Topic hub — 2026-10-21
Is finding broccoli, kale and other brassicas bitter down to a gene (TAS2R38)?
A caveat first: the full papers we could read that grouped people by genotype and compared vegetable bitterness are on rocket and turnip; none on broccoli or kale themselves is included. Two people can eat the same broccoli or kale and one finds it very bitter while the other barely notices. A common explanation is the type of the bitter-receptor gene TAS2R38: the PAV form, more sensitive to the bitter compounds PROP and PTC, and the less sensitive AVI form. What do studies that grouped people by genotype and compared the bitterness of real vegetables say? This page lines up the included studies together with their conditions: the vegetable and how it was cooked, who rated it on what scale, and how genotypes were grouped. It then separates what was established within one experiment, what differences between studies might explain, and what this comparison alone cannot separate. It is about how bitterness is perceived, not a diagnosis of anyone's constitution or dietary advice. This page mainly compares the bitterness of vegetables such as rocket and turnip; studies in which people of different genotypes rated standard PROP or PTC solutions, impregnated paper or dissolvable films are on the page Does the bitterness of PROP and PTC differ by TAS2R38 genotype?.
On this page (10 sections)
- What this page establishes
- What the included studies allow us to say
- Bitterness ratings at a glance
- Conditions and results, study by study
- What was established within an experiment
- Candidate explanations for the differences
- What is not known — what this comparison alone cannot separate
- How studies and rows were counted
- What we looked at
- Read in the encyclopedia
What this page establishes
- That some studies found genotype differences in perceived vegetable bitterness, significant in the overall analysis, but mostly not significant when looked at accession by accession or cooking method by cooking method.
- That for goitrin, a brassica compound, the gene variants account for only part of the variation in thresholds, and the authors write that most comes from other factors.
- That higher bitterness scores went with lower liking scores, but genotype did not clearly separate liking.
- That the full papers comparing genotypes on real vegetables come from one research group, and a widely cited older study could not be checked in the original.
What the included studies allow us to say
- No included study compared genotypes on broccoli or kale themselves; this answer rests on studies of rocket and turnip. Some studies found genotype differences in how bitter vegetables taste, but the groups separated clearly only under some conditions, and the results do not show that the gene decides it. For cooked turnip, the mean was 27.6 for the bitter-sensitive genotype (PAV/PAV) and 16.4 for the less sensitive one (AVI/AVI), a significant genotype effect (p=0.02). But the pairwise comparison only reached p=0.05, and of 4 cooking methods only stir-fried turnip separated significantly. [rows: Nor 2023 PAV/PAV vs AVI/AVI; Nor 2023 Stir-fried turnip]
- For rocket the genotype effect was also significant (P<0.02), but no accession showed a significant difference between genotypes. For goitrin, a brassica compound, in solution, the variants accounted for r²=0.16 of the variance in thresholds, and the authors write that most must come from other factors. The only full papers comparing genotypes on real vegetables were 2 from the same research group. [rows: Bell 2017 PAV/PAV vs AVI/AVI; Wooding 2010 Goitrin vs PROP; Nor 2023 PAV/PAV vs AVI/AVI]
Bitterness ratings at a glance
Human bitterness ratings. Values for "Group compared" and "Comparison" are as reported in the tables or text (values shown only in figures are marked as such). Besides comparisons between genotypes, rows on differences between vegetable accessions or cooking methods within the same study are included as a reference for how large differences are. "Direction" shows which sample was more bitter; whether the difference is significant is shown by the test in the same "Direction / test" column. Select a study name to jump to its detailed table.
Results in which people rated bitterness only. Where each value comes from (a table or a reading from a figure) is shown in its row; scales and methods differ between studies, so compare within a row, not across rows.
| Study | Comparison and condition | Measured as | Group compared | Comparison | Direction / test |
|---|---|---|---|---|---|
| Bell 2017 | PAV/PAV vs AVI/AVI Rocket, 7 accessions (genotype effect from an ANOVA over all accessions) | LMS antilogged and normalised (67 people) | tended higher (values only in a figure) | tended lower (values only in a figure) | Group compared more bitter Tested, significant overall but not pairwise |
| Bell 2017 | Accession SR12 vs SR19 Mean of all consumers regardless of genotype; SR12 highest and SR19 lowest of 7 accessions | LMS antilogged and normalised (67 people) | 27.1 | 21.2 | Group compared more bitter Tested, significant |
| Nor 2023 | PAV/PAV vs AVI/AVI Cooked turnip, mean over 4 cooking methods | exponentiated, normalised gLMS mean | 27.6 | 16.4 | Group compared more bitter Tested, significant overall but not pairwise |
| Nor 2023 | Stir-fried turnip Stir-fried turnip only, PAV/PAV vs AVI/AVI | exponentiated, normalised gLMS score | significantly higher (values only in a figure) | values only in a figure | Group compared more bitter Tested, significant |
| Nor 2023 | Steamed vs boiled purée Mean of all consumers regardless of genotype; steamed highest and boiled lowest of 4 methods | exponentiated, normalised gLMS mean | 20.8 | 16.0 | Group compared more bitter Tested, not significant |
| Wooding 2010 | Goitrin vs PROP Share of variance in thresholds accounted for by TAS2R38 variants | proportion of variance explained (50 people) | r²=0.16 (goitrin) | r²=0.50 (PROP; PTC 0.57) | Comparison higher No test reported |
Conditions and results, study by study
For each study, the conditions for the vegetable, cooking, how it was eaten and who rated it, and the results. Each row is one study × one measured result, so different comparisons in the same study are separate rows. Under each row we give where it is in the paper and whether it can be used to judge whether people with different bitter-receptor genotypes perceive brassica vegetables as differently bitter, with the reason. Nothing is left blank: "not given", "not read" and "not applicable" are kept apart.
Bell 2017 sensory only
The influence of phytochemical composition and resulting sensory attributes on preference for salad rocket (Eruca sativa) accessions by consumers of varying TAS2R38 diplotype. Food Chemistry — doi:10.1016/j.foodchem.2016.11.153
- How deeply checked
- Checked in full text — Full text via Europe PMC (Tables 2 and 3, Results); values by genotype only in Fig. 1, which was not viewed; supplementary tables not read Checked by: LLM (one extracted, another checked against the source; no human check), 2026-10-21.
- Samples
- Leaves of 7 salad rocket (Eruca sativa) accessions, grown under the same conditions and harvested 30 days after sowing
- Processing and cooking
- No cooking described (presumably raw leaves)
- How it was served or eaten
- 2 leaves per accession eaten as is, over 2 sessions
- Who rated, on what scale
- Untrained consumers recruited around the University of Reading, UK; 67 attending both sessions were analysed, while the genotype table lists 69 (PAV/PAV 16, PAV/AVI 35, AVI/AVI 18); bitterness on an LMS (labelled magnitude scale), antilogged and normalised, once per accession; ANOVA with genotype nested, and Tukey test
| Measured | Comparison and condition | Group compared | Comparison | Unit | Direction / test |
|---|---|---|---|---|---|
| Bitterness intensity (sensory) | PAV/PAV vs AVI/AVI Rocket, 7 accessions (genotype effect from an ANOVA over all accessions) | tended higher (values only in a figure) | tended lower (values only in a figure) | LMS antilogged and normalised (67 people) | Group compared more bitter Tested, significant overall but not pairwise |
| Genotype effect significant at P<0.02, but no significant differences between genotypes within any accession; the abstract does not report a significant genotype effect on bitterness and says bitterness did not significantly influence liking (in the text, bitterness and liking scores are negatively related). Genotype effect on taste liking P<0.004, but no significant differences in comparisons within accessions; the authors note liking went the other way for the commercial accession SR3. Bitterness and taste liking were negatively correlated (r=−0.227) Where: Results, 'Taste liking and bitterness perception'; Table 3; Fig. 1 For whether people with different bitter-receptor genotypes (TAS2R38) perceive brassica vegetables as differently bitter: Limited — Bitterness of a real vegetable compared by genotype, but values are only in a figure and no difference appeared within accessions | |||||
| Bitterness intensity (sensory) | Accession SR12 vs SR19 Mean of all consumers regardless of genotype; SR12 highest and SR19 lowest of 7 accessions | 27.1 | 21.2 | LMS antilogged and normalised (67 people) | Group compared more bitter Tested, significant |
| Accession effect P=0.004; by Tukey test SR12 was significantly more bitter than SR6 (21.8) and SR19; other pairs not significant Where: Table 2 For whether people with different bitter-receptor genotypes (TAS2R38) perceive brassica vegetables as differently bitter: Not usable — Accession difference, not genotype; a reference for how large accession differences are on the same scale | |||||
Nor 2023 sensory only
Consumer Liking of Turnip Cooked by Different Methods: The Influence of Sensory Profile and Consumer Bitter Taste Genotype. Foods — doi:10.3390/foods12173188
- How deeply checked
- Checked in full text — Full text via Europe PMC (Results 3.3 and 3.4, Tables 2–4); values by cooking method and genotype only in Fig. 1, which was not viewed Checked by: LLM (one extracted, another checked against the source; no human check), 2026-10-21.
- Samples
- Shop-bought turnip (Brassica rapa subsp. rapa), peeled and cut about 0.5 cm thick
- Processing and cooking
- 4 methods: boiled and puréed (10 min), steamed and puréed (15 min), roasted with oil (200 °C for 15 min plus 5 min) and stir-fried with oil (7 min); frozen at −18 °C for 2–3 weeks, reheated to above 75 °C and served at 40–45 °C
- How it was served or eaten
- 2 slices, or about 15 g of purée
- Who rated, on what scale
- 74 untrained staff and students of the University of Reading; genotypes PAV/PAV 14, PAV/AVI 30, AVI/AVI 23, with 7 people of rare genotypes excluded from the genotype analysis (cooking compared across all 74); bitterness on an exponentiated, normalised gLMS; mixed ANOVA and Tukey test
| Measured | Comparison and condition | Group compared | Comparison | Unit | Direction / test |
|---|---|---|---|---|---|
| Bitterness intensity (sensory) | PAV/PAV vs AVI/AVI Cooked turnip, mean over 4 cooking methods | 27.6 | 16.4 | exponentiated, normalised gLMS mean | Group compared more bitter Tested, significant overall but not pairwise |
| Genotype effect significant, F(2,256)=4.14, p=0.02; pairwise, PAV/PAV vs AVI/AVI p=0.05 and vs PAV/AVI (16.9) p=0.07, which the authors call a tendency; PAV/AVI vs AVI/AVI p=0.99. No significant genotype effect on taste liking (p=0.38); bitterness and taste liking correlated at r=−0.35 Where: Results 3.4 For whether people with different bitter-receptor genotypes (TAS2R38) perceive brassica vegetables as differently bitter: Limited — Bitterness of cooked turnip compared by genotype; the overall effect was significant but pairwise differences did not reach significance | |||||
| Bitterness intensity (sensory) | Stir-fried turnip Stir-fried turnip only, PAV/PAV vs AVI/AVI | significantly higher (values only in a figure) | values only in a figure | exponentiated, normalised gLMS score | Group compared more bitter Tested, significant |
| PAV/PAV significantly higher than AVI/AVI (p=0.001) and PAV/AVI (p=0.02); no significant difference is reported for the other 3 methods; the cooking × genotype interaction was p=0.07, not significant Where: Results 3.4; Fig. 1 For whether people with different bitter-receptor genotypes (TAS2R38) perceive brassica vegetables as differently bitter: Limited — Significant for only 1 of 4 cooking methods, one comparison among many | |||||
| Bitterness intensity (sensory) | Steamed vs boiled purée Mean of all consumers regardless of genotype; steamed highest and boiled lowest of 4 methods | 20.8 | 16.0 | exponentiated, normalised gLMS mean | Group compared more bitter Tested, not significant |
| Cooking effect F(3,219)=2.38, p=0.07, not significant (which does not mean the same); a trained panel of 10 also found no significant cooking effect on bitterness (p=0.38) Where: Results 3.1 and 3.4; Table 2 For whether people with different bitter-receptor genotypes (TAS2R38) perceive brassica vegetables as differently bitter: Not usable — Difference in cooking, not a genotype comparison | |||||
Wooding 2010 sensory only
Genetics and bitter taste responses to goitrin, a plant toxin found in vegetables. Chemical Senses 35(8):685-692 — doi:10.1093/chemse/bjq061
- How deeply checked
- Abstract only — Abstract only (full text could not be obtained) Checked by: LLM (one extracted, another checked against the source; no human check), 2026-10-21.
- Samples
- Goitrin (a compound found in brassica vegetables), with PROP and PTC for comparison; preparation not in the abstract
- Processing and cooking
- Not applicable (a compound, not a vegetable)
- How it was served or eaten
- Not given (not in the abstract)
- Who rated, on what scale
- 50 people; threshold taste responses measured and related to TAS2R38 variants; country, numbers per genotype and method details not in the abstract
| Measured | Comparison and condition | Group compared | Comparison | Unit | Direction / test |
|---|---|---|---|---|---|
| Bitterness threshold (sensory) | Goitrin vs PROP Share of variance in thresholds accounted for by TAS2R38 variants | r²=0.16 (goitrin) | r²=0.50 (PROP; PTC 0.57) | proportion of variance explained (50 people) | Comparison higher No test reported |
| The association of goitrin thresholds with the variants was significant (P=9.3×10⁻³); no test of the difference in r² is reported in the abstract. In cell assays the insensitive (AVI) receptor did not respond to goitrin. The authors write that most of the variance must be explained by other factors Where: Abstract For whether people with different bitter-receptor genotypes (TAS2R38) perceive brassica vegetables as differently bitter: Limited — A compound in solution rather than a vegetable, thresholds rather than bitterness intensity, and only the abstract was read | |||||
What was established within an experiment
Only results where the same panel ate the same samples and were compared by genotype or condition within one study.
- When turnip cooked 4 ways was tasted, mean bitterness was 27.6 for PAV/PAV, 16.9 for PAV/AVI and 16.4 for AVI/AVI, a significant genotype effect (p=0.02). Pairwise, p=0.05 and p=0.07; only stir-fried turnip separated significantly (p=0.001 and p=0.02). Genotype had no significant effect on taste liking (p=0.38). [rows: Nor 2023 PAV/PAV vs AVI/AVI; Nor 2023 Stir-fried turnip]
- For rocket, 7 accessions, the genotype effect was significant (P<0.02) and the less sensitive genotype (AVI/AVI) tended to score lower, but no accession showed a significant difference between genotypes. [rows: Bell 2017 PAV/PAV vs AVI/AVI]
- Goitrin thresholds were significantly associated with TAS2R38 variants (P=9.3×10⁻³), but the variants accounted for r²=0.16 of the variance, less than 0.50 for PROP (from the abstract). [rows: Wooding 2010 Goitrin vs PROP]
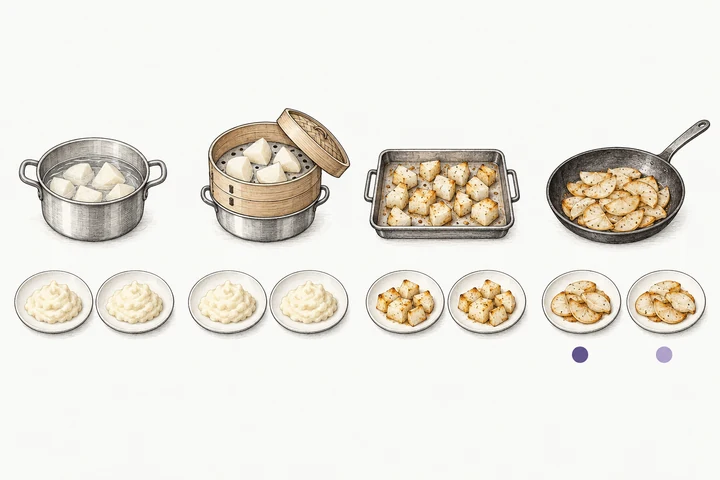
Boiled
Steamed
Roasted
Stir-fried
In each column, left plate: PAV/PAV (more sensitive) / right plate: AVI/AVI (less sensitive)
A study in which cooked turnip, prepared four ways, was compared between people with the more sensitive genotype (PAV/PAV, left plate in each column) and the less sensitive genotype (AVI/AVI, right plate). A significant genotype difference by cooking method was reported only for stir-fried turnip, and the shade of the purple marks shows only that order (more bitter for the sensitive genotype). The other three methods were also measured, but the genotype difference was not significant, and this figure shows neither direction nor size for them (it does not mean they were the same). The purple is not a real colour.
Source: Nor et al. 2023 (Nor 2023 in the table of conditions and results by study)
Illustration: illustration desk (PurpleHeron)
Candidate explanations for the differences
Conditions that differ between studies, or between samples, and could explain differences in perceived bitterness. Several conditions differ at once, so which one mattered is unknown. These are candidates, not causes.
- Differences on the vegetable side also move bitterness: across rocket accessions the mean of all consumers ranged from 21.2 to 27.1 (P=0.004). The kind and amount of bitter compounds is a candidate for why genotype differences show for some vegetables and not others, but no included study tested how compound levels relate to bitterness within each genotype group. [rows: Bell 2017 Accession SR12 vs SR19]
- In both studies, higher bitterness scores went with lower taste-liking scores (r=−0.227, r=−0.35). The genotype effect on liking, however, was not significant for turnip (p=0.38), and for rocket it was significant overall (P<0.004) but not in comparisons within accessions. The authors point to pungency, sweetness and the texture from cooking, beyond bitterness. [rows: Bell 2017 PAV/PAV vs AVI/AVI; Nor 2023 PAV/PAV vs AVI/AVI]
What is not known — what this comparison alone cannot separate
- The full papers comparing genotypes on real vegetables are 2 from the same research group, both with young, mostly female participants recruited at a UK university. Whether the same direction holds for people in other countries or Japan, or for broccoli and kale, cannot be separated by this comparison. [rows: Bell 2017 PAV/PAV vs AVI/AVI; Nor 2023 PAV/PAV vs AVI/AVI]
- A widely cited study in which PAV/PAV people found brassica vegetables more bitter (Sandell and Breslin) and a study of raw broccoli and cabbage (Shen et al.) could not be obtained and are not in the table. Whether dislike is set by constitution alone or changes with familiarity and preparation cannot be separated by the included studies. [rows: Bell 2017 PAV/PAV vs AVI/AVI; Nor 2023 PAV/PAV vs AVI/AVI]
How studies and rows were counted
The number of evidence rows is not the number of studies. Table rows, ledger evidence rows, papers and research groups are counted separately.
- Sources in the table: 3, of which 3 have results on people's bitterness ratings in this table; for the others, only results on something else (compounds, smell) are shown, or they are used only for context.
- Rows in the table (study × measured result): 6. Rows on perceived bitterness: 6.
- Evidence rows in the lab's ledger these rows rest on: 0. One paper can supply several rows. Rows without a ledger evidence row come from other tables of the same papers, or from sources newly read for this question.
- Research groups among the studies with bitterness results in this table, as grouped in the ledger: 2 (reports from the same lab count as 1; co-authors and affiliations can overlap, so this is not a count of independent replications).
What we looked at
The sources examined for this question, why each was included or excluded, and which full texts could not be reached. We searched Europe PMC for studies on TAS2R38 and the bitterness of brassica vegetables (broccoli, kale, cabbage, rocket, turnip and others), and added the sources already in the lab's ledger (J-STAGE and CiNii were not searched). Studies that looked only at vegetable intake without measuring bitterness are listed as context, and only some of them.
| Source | Decision | Why |
|---|---|---|
| The influence of phytochemical composition and resulting sensory attributes on preference for salad rocket (Eruca sativa) accessions by consumers of varying TAS2R38 diplotype (2017) doi | Included in the table | Rocket bitterness compared by genotype; read in full |
| Consumer Liking of Turnip Cooked by Different Methods: The Influence of Sensory Profile and Consumer Bitter Taste Genotype (2023) doi | Included in the table | Cooked turnip bitterness compared by genotype; read in full |
| Genetics and bitter taste responses to goitrin, a plant toxin found in vegetables (2010) doi | Included in the table | Thresholds for a brassica compound against genotype; abstract only |
| Variability in a taste-receptor gene determines whether we taste toxins in food (2006) doi | Full text not reachable | Widely cited for brassica bitterness by genotype; a short correspondence with no abstract, and the full-text page stopped at a verification screen |
| Exploring the effects of genotypical and phenotypical variations in bitter taste sensitivity on perception, liking and intake of brassica vegetables in the UK (2016) doi | Full text not reachable | Raw broccoli and cabbage bitterness, liking and intake against genotype; neither full text nor abstract obtained |
| Vegetable Intake in College-Aged Adults Is Explained by Oral Sensory Phenotypes and TAS2R38 Genotype (2010) doi | Excluded | Vegetable intake against genotype (bitterness measured only for PROP and quinine solutions); vegetable bitterness not measured, so listed for reference rather than tabled |
| TAS2R38 Predisposition to Bitter Taste Associated with Differential Changes in Vegetable Intake in Response to a Community-Based Dietary Intervention (2018) doi | Excluded | Vegetable intake before and after a dietary intervention against genotype; bitterness not measured, so listed for reference rather than tabled |
| Bitter taste sensitivity is minimally associated with adult food preferences and intake, with a negative association to carbohydrate consumption: A systematic review and meta-analysis (2026) doi | Read as context (not in the table) | Meta-analysis of bitter sensitivity against food preference and intake; abstract only, not a study of vegetable bitterness ratings |
| Bitter taste of Brassica vegetables: The role of genetic factors, receptors, isothiocyanates, glucosinolates, and flavor context (2018) doi | Read as context (not in the table) | Review; abstract only, which does not name the studies covered |
| Sensory Attributes Driving Preference for Wild Rocket (Diplotaxis tenuifolia) Leaves Tasted as a Single Ingredient and as a Part of a Recipe (2024) doi | Excluded | Read in full, but genotype and PROP status not studied |
| Association of phenylthiocarbamide perception with anthropometric variables and intake and liking for bitter vegetables (2022) doi | Excluded | PTC taster status rather than genotype; vegetable bitterness not rated |
Read in the encyclopedia
- TAS2R38 — the receptor in this question
- Bitter receptors — the receptor topic hub
- Do beers with higher IBU taste more bitter? — a comparison page in the same format
Source ledger
Each study's source can be reached from its section above. All of the lab's sources are listed in the source ledger.
How to cite this page
Aoki, M. (NIGAMI LAB) (2026). Is brassica bitterness down to the TAS2R38 gene?. https://nigamilab.com/en/topics/tas2r38-brassica/
Each claim card has a stable anchor (#clm-…). The dataset is CC BY 4.0; see the data page. Dataset DOI: 10.5281/zenodo.22739101