Topic hub — 2026-10-21
Does cheese bitterness change with ripening and the choice of starter bacteria?
A caveat first: few studies could be read in full down to the values, and the only one comparing strains and ripening time in a ripened cheese is a study of reduced-fat Cheddar. Ripened cheese sometimes turns bitter, and a common explanation is that milk protein (casein) is broken down by the enzymes of the starter bacteria into bitter peptides. What do studies that changed the starter strain or the ripening time and had people compare bitterness say? This page lines up the included studies together with their conditions: the cheese type, the starter strains or adjuncts, ripening temperature and time, and who rated it on what scale. It then separates what was established within one experiment, what differences between studies might explain, and what this comparison alone cannot separate. It compares studies; it is not advice on choosing or making cheese.
On this page (10 sections)
- What this page establishes
- What the included studies allow us to say
- Bitterness ratings at a glance
- Conditions and results, study by study
- What was established within an experiment
- Candidate explanations for the differences
- What is not known — what this comparison alone cannot separate
- How studies and rows were counted
- What we looked at
- Read in the encyclopedia
What this page establishes
- That in one study, starters from the same parent differing only in enzyme type clearly changed the bitterness people perceived.
- That bitterness rose with ripening, but the significant comparison was of the mean over strains, and results for ripening differences within each strain are not shown.
- That strain differences were significant at some time points and not others, and that one study's conclusions and results disagree.
- That one study of adjunct bacteria conflicts between abstract and text on the direction of bitterness, studies of yeasts could be read only as abstracts, and scales and cheese types differ between studies, so scores cannot be set side by side.
What the included studies allow us to say
- Changing the starter strain changed the bitterness people perceived in cheese. In reduced-fat Cheddar made with strains from one parent differing only in their proteinase, the mean over 3 time points was 1.5 for the strain without the enzyme and 3.9 for the group h strain (0–9 scale). Bitterness also rose with ripening: the mean of the 4 strains was 2.4 at 2 months, 2.9 at 4 months and 3.6 at 6 months, with 6 months significantly higher than the other 2 time points. [rows: Broadbent 2002 group h strain vs no-proteinase strain; Broadbent 2002 6 vs 2 months]
- But the only ripened-cheese study whose bitterness values could be checked in full text was the reduced-fat Cheddar one. In unripened fresh cheese too, strains with the proteinase gene prtP (3.9, 4.1) were more bitter than strains without it (1.7, 2.8) on a 0–5 scale. A study of adjunct bacteria could be read in full but gives no values, and studies of yeasts and other starters could be read only as abstracts. [rows: Forler 2021 prtP-positive vs prtP-negative strains; Benech 2003 Nisin-producing strain vs without nisin; Ferreira 2003 1 yeast alone vs both; Midje 2000 SK11 as main starter vs commercial starter]
Bitterness ratings at a glance
Human bitterness ratings. Values for "Group compared" and "Comparison" are as reported in the tables or text (values shown only in figures are marked as such). Besides comparisons between strains, rows on ripening time are included. For studies read only as abstracts, only the direction stated in the abstract is shown. "Direction" shows which sample was more bitter; whether the difference is significant is shown by the test in the same "Direction / test" column. Select a study name to jump to its detailed table.
Results in which people rated bitterness only. Where each value comes from (a table or a reading from a figure) is shown in its row; scales and methods differ between studies, so compare within a row, not across rows.
| Study | Comparison and condition | Measured as | Sample compared | Comparison | Direction / test |
|---|---|---|---|---|---|
| Broadbent 2002 | group h strain vs no-proteinase strain Reduced-fat Cheddar, mean over 3 time points (2, 4, 6 months) | mean on a 0–9 scale (trained panel of 14; number per session not given) | 3.9 | 1.5 | Sample compared more bitter Tested, significant |
| Broadbent 2002 | At 2 months At 2 months, group a and group e strains vs no-proteinase strain | mean on a 0–9 scale (trained panel of 14; number per session not given) | 2.5 (group a), 2.2 (group e) | 1.4 | Sample compared more bitter Tested, not significant |
| Broadbent 2002 | 6 vs 2 months Mean over the 4 strains | mean on a 0–9 scale (trained panel of 14; number per session not given) | 3.6 | 2.4 | Sample compared more bitter Tested, significant |
| Forler 2021 | prtP-positive vs prtP-negative strains Unripened fresh cheese, 2 strains each | 0–5 scale | 3.9 (LTH 7123), 4.1 (LTH 7122) | 1.7 (LTH 7117), 2.8 (LTH 7112) | Sample compared more bitter Tested, significant |
| Forler 2021 | prtP-negative strain vs control Unripened fresh cheese, against a control acidified without fermentation | 0–5 scale | 2.8 (LTH 7112) | 1.0 | Sample compared more bitter Tested, significant |
| Benech 2003 | Nisin-producing strain vs without nisin Cheddar, 6 months | not given | stronger in the abstract, weaker in the text (conflict) | values not given | Direction not given No test reported |
| Ferreira 2003 | 1 yeast alone vs both Cheddar with yeasts as adjunct starters | not given (not in the abstract) | bitter flavours developed (abstract wording, no values) | no bitterness stated (abstract says flavour was good with both) | Direction not given No test reported |
| Midje 2000 | SK11 as main starter vs commercial starter Reduced-fat Cheddar, up to 150 days | not given (not in the abstract) | substantially lower (abstract wording, no values) | values not in the abstract | Comparison more bitter No test reported |
Conditions and results, study by study
For each study, the conditions for the cheese and strains, ripening, serving and who rated it, and the results. Each row is one study × one measured result, so different comparisons in the same study are separate rows. Under each row we give where it is in the paper and whether it can be used to judge whether the starter strain or the length of ripening changes the bitterness people perceive in cheese, with the reason. Nothing is left blank: "not given", "not read" and "not applicable" are kept apart.
Broadbent 2002 sensory only
Contribution of Lactococcus lactis cell envelope proteinase specificity to peptide accumulation and bitterness in reduced-fat Cheddar cheese. Applied and Environmental Microbiology — doi:10.1128/aem.68.4.1778-1785.2002
- How deeply checked
- Checked in full text — Full text via PMC (Tables 3–5, Results); correlations of bitterness with peptides read from the text on Fig. 3 Checked by: LLM (one extracted, another checked against the source; no human check), 2026-10-21.
- Samples
- Reduced-fat (50%) Cheddar; 4 isogenic single-strain starters from the same parent (an L. lactis lacking its main autolysin), differing only in the type of the proteinase lactocepin (none, group a, group e, group h); 2 vats per condition
- Processing and cooking
- 9 kg blocks vacuum-packed and ripened at 7 °C; evaluated at 2, 4 and 6 months
- How it was served or eaten
- 3 g samples, coded, in random order
- Who rated, on what scale
- 14 panellists screened with quinine and trained about 10 times; 0–9 bitterness scale (1 is 'just detectable' in the Methods but 'no perceptible bitterness' in the table footnote); ANOVA; number per session, replicates, variability and multiple-comparison method not given
| Measured | Comparison and condition | Sample compared | Comparison | Unit | Direction / test |
|---|---|---|---|---|---|
| Bitterness intensity (sensory) | group h strain vs no-proteinase strain Reduced-fat Cheddar, mean over 3 time points (2, 4, 6 months) | 3.9 | 1.5 | mean on a 0–9 scale (trained panel of 14; number per session not given) | Sample compared more bitter Tested, significant |
| Strain effect P<0.0001; the group a (3.1) and group e (3.2) strains were also significantly more bitter than the no-proteinase strain; only the group h strain was significantly more bitter than it at all 3 time points. Bitterness correlated at r=0.56 with αS1-CN f1-9 (a peptide made by lactocepin) and at r=0.58 with β-CN f193-209, which comes from the coagulant chymosin and showed no strain effect on its concentration (P>0.5) Where: Table 5; Results; Fig. 3 For whether the starter strain or the length of ripening changes the bitterness people perceive in cheese: Usable — Only the enzyme type differed between strains from one parent, with the same make and ripening, and people compared bitterness | |||||
| Bitterness intensity (sensory) | At 2 months At 2 months, group a and group e strains vs no-proteinase strain | 2.5 (group a), 2.2 (group e) | 1.4 | mean on a 0–9 scale (trained panel of 14; number per session not given) | Sample compared more bitter Tested, not significant |
| At 2 months only the group h strain (3.5) was significantly more bitter than the no-proteinase strain; group a and group e were not significantly different; group a was also not significantly different at 6 months (3.5) Where: Table 5 For whether the starter strain or the length of ripening changes the bitterness people perceive in cheese: Usable — A same-time comparison within one study, showing that whether strain differences are significant depends on the time point | |||||
| Bitterness intensity (sensory) | 6 vs 2 months Mean over the 4 strains | 3.6 | 2.4 | mean on a 0–9 scale (trained panel of 14; number per session not given) | Sample compared more bitter Tested, significant |
| Effect of months of ripening P<0.0001; 4 months was 2.9, 6 months was significantly higher than 2 and 4 months, and 2 vs 4 months was not significant. The no-proteinase strain went from 1.4 to 1.8; results for month differences within each strain or a strain × month interaction are not shown Where: Table 5 For whether the starter strain or the length of ripening changes the bitterness people perceive in cheese: Limited — An effect of ripening time, but as a mean over 4 strains, with no results shown for month differences within each strain | |||||
Forler 2021 sensory only
Effects of Protein, Calcium, and pH on Gene Transcription, Cell-Envelope Peptidase Activity of Lactococcus lactis Strains, and the Formation of Bitter Peptides. Foods 10(7):1588 — doi:10.3390/foods10071588
- How deeply checked
- Checked in full text — Full text via Europe PMC (sections 2.2.2 and 3.1, Tables 1 and 2); variability and significance letters only in Fig. 1, which was not viewed Checked by: LLM (one extracted, another checked against the source; no human check), 2026-10-21.
- Samples
- Unripened fresh cheese (fermented concentrated milk protein; 8.5% protein, 74 mM calcium); 2 L. lactis strains with the proteinase gene prtP (LTH 7122, 7123) and 2 without (LTH 7112, 7117), each used alone; control acidified with citric acid without fermentation; each made twice
- Processing and cooking
- Fermented at 22.5 °C to pH 4.7 (strains without prtP stopped at pH 5.1 and 5.5); stored at 6 °C or below for 1 week
- How it was served or eaten
- 20–30 g at about 10 °C, homogenised, tasted with nose clips
- Who rated, on what scale
- 12–13 of a 25-member trained panel per session; 0–5 line scale (reference samples each time: a commercial cheese as 0 and the LTH 7122 fresh cheese as 4); ANOVA and Fisher's LSD
| Measured | Comparison and condition | Sample compared | Comparison | Unit | Direction / test |
|---|---|---|---|---|---|
| Bitterness intensity (sensory) | prtP-positive vs prtP-negative strains Unripened fresh cheese, 2 strains each | 3.9 (LTH 7123), 4.1 (LTH 7122) | 1.7 (LTH 7117), 2.8 (LTH 7112) | 0–5 scale | Sample compared more bitter Tested, significant |
| The text reports significantly higher values for the prtP-positive strains; the LTH 7122 fresh cheese was also given each session as a reference fixed at 4, and 4.1 is close to it. The conclusions say the negative strains did not introduce bitterness, but the results and discussion report LTH 7112 as significantly more bitter than the control Where: Section 3.1; Fig. 1 For whether the starter strain or the length of ripening changes the bitterness people perceive in cheese: Limited — People compared strains, but in unripened fresh cheese with no ripening; the strains also differ in subspecies and supplier | |||||
| Bitterness intensity (sensory) | prtP-negative strain vs control Unripened fresh cheese, against a control acidified without fermentation | 2.8 (LTH 7112) | 1.0 | 0–5 scale | Sample compared more bitter Tested, significant |
| The Discussion states that the negative strain LTH 7112 was significantly more bitter than the control; the test result for the other negative strain (1.7) against the control cannot be confirmed from the text Where: Section 4 (Discussion); Fig. 1 For whether the starter strain or the length of ripening changes the bitterness people perceive in cheese: Limited — A comparison of fermented vs not fermented, not of enzyme presence | |||||
Benech 2003 sensory only
Impact of Nisin Producing Culture and Liposome-Encapsulated Nisin on Ripening of Lactobacillus Added-Cheddar Cheese. Journal of Dairy Science 86(6):1895-1909 — doi:10.3168/jds.S0022-0302(03)73776-X
- How deeply checked
- Checked in full text — Full text (sensory results, Table 6), re-read in the full-text re-evaluation of 2026-10-21 Checked by: LLM (one extracted, another checked against the source; no human check), 2026-10-21.
- Samples
- Cheddar made with a nisin-tolerant starter, combined with a nisin-producing L. lactis (UL719), an adjunct L. casei-casei L2A and liposome-encapsulated nisin Z
- Processing and cooking
- Ripened 6 months
- How it was served or eaten
- About 100 g of cheese cut into 5 g cubes and coded with random 4-digit numbers; taken from the refrigerator (7 °C) and held 1 h at room temperature (22±1 °C) before serving
- Who rated, on what scale
- 5 trained and experienced panellists rated texture, flavour and overall quality on a 5-point hedonic scale, each in triplicate. Results are given as flavour-defect descriptions and an overall-quality ranking, with no numerical table of bitterness intensity. Statistics: ANOVA with Fisher's PLSD (whether applied to the sensory results cannot be confirmed from the text)
| Measured | Comparison and condition | Sample compared | Comparison | Unit | Direction / test |
|---|---|---|---|---|---|
| Bitterness intensity (sensory) | Nisin-producing strain vs without nisin Cheddar, 6 months | stronger in the abstract, weaker in the text (conflict) | values not given | not given | Direction not given No test reported |
| The abstract says adding the nisin-producing strain enhanced acidic and bitter tastes, but the sensory results in the text say the cheese was less bitter than cheese made with the same starter without nisin, so the two conflict. Cheese with an adjunct L. casei was less bitter and ranked higher in flavour quality (the text attributes this mainly to L. casei) Where: Abstract; sensory results in the text; Table 6 For whether the starter strain or the length of ripening changes the bitterness people perceive in cheese: Limited — People compared adjunct cultures, but for the nisin-producing strain the abstract and text conflict on the direction of bitterness, and no values are given | |||||
Ferreira 2003 sensory only
Yeasts as Adjunct Starters in Matured Cheddar Cheese. International Journal of Food Microbiology 86(1-2):131-140 — doi:10.1016/s0168-1605(03)00252-6
- How deeply checked
- Abstract only — Abstract only (full text paywalled) Checked by: LLM (one extracted, another checked against the source; no human check), 2026-10-21.
- Samples
- Cheddar with the yeasts D. hansenii or Y. lipolytica, or both, as adjunct starters; control without yeast
- Processing and cooking
- Ripened (the abstract says the cheese with both yeasts kept a good flavour 9 months after manufacture; ripening temperature and when bitterness was assessed not in the abstract)
- How it was served or eaten
- Not given (not in the abstract)
- Who rated, on what scale
- Sensory method not in the abstract
| Measured | Comparison and condition | Sample compared | Comparison | Unit | Direction / test |
|---|---|---|---|---|---|
| Bitterness intensity (sensory) | 1 yeast alone vs both Cheddar with yeasts as adjunct starters | bitter flavours developed (abstract wording, no values) | no bitterness stated (abstract says flavour was good with both) | not given (not in the abstract) | Direction not given No test reported |
| The abstract says each yeast added alone contributed to bitter flavours and that with both yeasts a good flavour persisted at 9 months; no comparison of bitterness intensity between single and combined additions and no test in the abstract Where: Abstract For whether the starter strain or the length of ripening changes the bitterness people perceive in cheese: Limited — An effect of yeast adjuncts rather than bacterial strains; whether bitterness intensity was scored is unclear from the abstract | |||||
Midje 2000 sensory only
Flavor Enhancement of Reduced Fat Cheddar Cheese Using an Integrated Culturing System. Journal of Agricultural and Food Chemistry 48(5):1630-1636 — doi:10.1021/jf990301w
- How deeply checked
- Abstract only — Abstract only (full text paywalled) Checked by: LLM (one extracted, another checked against the source; no human check), 2026-10-21.
- Samples
- Reduced-fat Cheddar made with L. lactis subsp. cremoris SK11 as the main starter combined with L. lactis biovar diacetylactis JVI and L. casei 7A, versus a commercial starter
- Processing and cooking
- Ripened 150 days
- How it was served or eaten
- Not given (not in the abstract)
- Who rated, on what scale
- Panel size and scale not in the abstract
| Measured | Comparison and condition | Sample compared | Comparison | Unit | Direction / test |
|---|---|---|---|---|---|
| Bitterness intensity (sensory) | SK11 as main starter vs commercial starter Reduced-fat Cheddar, up to 150 days | substantially lower (abstract wording, no values) | values not in the abstract | not given (not in the abstract) | Comparison more bitter No test reported |
| The abstract says cheeses made with SK11 had 'substantially lower' bitterness intensity than those with the commercial starter; values and tests not in the abstract Where: Abstract For whether the starter strain or the length of ripening changes the bitterness people perceive in cheese: Limited — The abstract reports comparing main starters, but values, panel and tests were not checked in the full text | |||||
What was established within an experiment
Only results where the same panel compared changed conditions within one study.
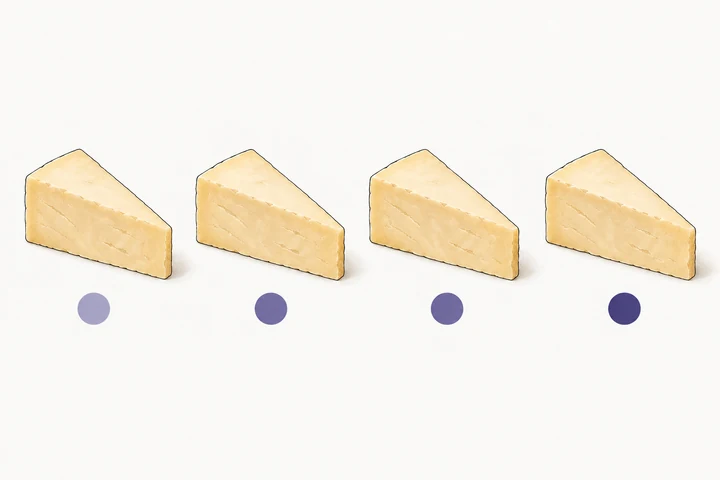
- In reduced-fat Cheddar both strain and ripening time had significant effects on bitterness (P<0.0001). Over 3 time points the group a (3.1), group e (3.2) and group h (3.9) strains were significantly more bitter than the strain without the enzyme (1.5), but at 2 months only group h (3.5) was significantly more bitter, while group a (2.5) and group e (2.2) were not significantly different from the strain without the enzyme (1.4). [rows: Broadbent 2002 group h strain vs no-proteinase strain; Broadbent 2002 At 2 months]
- In unripened fresh cheese, the prtP-positive strains (3.9, 4.1) were significantly more bitter than the negative strains (1.7, 2.8). The conclusions say the negative strains did not introduce bitterness, but the Discussion reports LTH 7112 (2.8) as significantly more bitter than a control acidified without fermentation (1.0). [rows: Forler 2021 prtP-positive vs prtP-negative strains; Forler 2021 prtP-negative strain vs control]
No enzyme
group a
group e
group h
A study of reduced-fat Cheddar made with four starter strains derived from the same parent, differing only in the type of protein-splitting enzyme. The shade of the purple marks shows only the rough order of mean bitterness averaged over three ripening times. The two in the centre had close means and are drawn in the same shade; this does not mean equal values or no difference, nor that every pair differs significantly. Ripening time is not shown. The four cheeses are drawn alike. The purple is not a real colour.
Source: Broadbent et al. 2002 (Broadbent 2002 in the table of conditions and results by study)
Illustration: illustration desk (PurpleHeron)
Candidate explanations for the differences
Conditions that differ between studies, or between samples, and could explain differences in bitterness. Several conditions differ at once, so which one mattered is unknown. These are candidates, not causes.
- A candidate explanation for strain differences is the amount of bitter peptide that the bacterial proteinase lactocepin makes from casein. In the reduced-fat Cheddar, bitterness correlated at r=0.56 with αS1-CN f1-9, a peptide made by lactocepin. The other peptide, β-CN f193-209 (r=0.58), comes from the coagulant chymosin and showed no strain effect on its concentration (P>0.5). Both are correlations, so they do not show that those peptides set the bitterness. [rows: Broadbent 2002 group h strain vs no-proteinase strain]
- Some studies report that adjunct bacteria, yeasts and the choice of main starter also move bitterness. Cheese with an adjunct L. casei was less bitter (full text). For the nisin-producing strain, the abstract (more bitter) and the text (less bitter than without nisin) conflict. Abstracts also say a single yeast alone produced bitter flavours and SK11 as the main starter gave substantially lower bitterness than a commercial starter. Values and tests were not checked. [rows: Benech 2003 Nisin-producing strain vs without nisin; Ferreira 2003 1 yeast alone vs both; Midje 2000 SK11 as main starter vs commercial starter]
What is not known — what this comparison alone cannot separate
- Between studies the cheese type (ripened reduced-fat Cheddar vs unripened fresh cheese), the scale (0–9 vs 0–5) and the panels differ, so the bitterness scores cannot be set side by side. [rows: Broadbent 2002 group h strain vs no-proteinase strain; Forler 2021 prtP-positive vs prtP-negative strains]
- Whether the same direction holds for full-fat cheese or other types such as Gouda, and how ripening time and strain combine, cannot be separated by the included studies. Only the reduced-fat Cheddar study let us check both strain and ripening time in full text. [rows: Broadbent 2002 group h strain vs no-proteinase strain; Broadbent 2002 6 vs 2 months]
How studies and rows were counted
The number of evidence rows is not the number of studies. Table rows, ledger evidence rows, papers and research groups are counted separately.
- Sources in the table: 5, of which 5 have results on people's bitterness ratings in this table; for the others, only results on something else (compounds, smell) are shown, or they are used only for context.
- Rows in the table (study × measured result): 8. Rows on perceived bitterness: 8.
- Evidence rows in the lab's ledger these rows rest on: 0. One paper can supply several rows. Rows without a ledger evidence row come from other tables of the same papers, or from sources newly read for this question.
- Research groups among the studies with bitterness results in this table, as grouped in the ledger: 5 (reports from the same lab count as 1; co-authors and affiliations can overlap, so this is not a count of independent replications).
What we looked at
The sources examined for this question, why each was included or excluded, and which full texts could not be reached. We searched Europe PMC for studies in which people rated cheese bitterness while starter strains, adjunct cultures or ripening time were varied, and added the sources already in the lab's ledger (J-STAGE and CiNii were not searched). Where the full-text page stopped at a verification screen or was paywalled, the study is marked as read from the abstract only.
| Source | Decision | Why |
|---|---|---|
| Contribution of Lactococcus lactis cell envelope proteinase specificity to peptide accumulation and bitterness in reduced-fat Cheddar cheese (2002) doi | Included in the table | Only the strains' enzyme varied, with bitterness compared at each ripening time; read in full |
| Effects of Protein, Calcium, and pH on Gene Transcription, Cell-Envelope Peptidase Activity of Lactococcus lactis Strains, and the Formation of Bitter Peptides (2021) doi | Included in the table | Bitterness of different strains compared in fresh cheese; read in full |
| Impact of Nisin Producing Culture and Liposome-Encapsulated Nisin on Ripening of Lactobacillus Added-Cheddar Cheese (2003) doi | Included in the table | Direction of bitterness with adjunct cultures; abstract only |
| Yeasts as Adjunct Starters in Matured Cheddar Cheese (2003) doi | Included in the table | Direction of bitterness with yeast adjuncts; abstract only |
| Flavor Enhancement of Reduced Fat Cheddar Cheese Using an Integrated Culturing System (2000) doi | Included in the table | Direction of bitterness with different main starters; abstract only |
| Change of proteolysis and sensory profile during ripening of Cheddar-style cheese as influenced by a microbial rennet from rice wine (2019) doi | Excluded | Coagulant comparison; bitterness values only in a figure and no test result for bitterness alone |
| Application of Exopolysaccharide-Producing Cultures in Reduced-Fat Cheddar Cheese: Composition and Proteolysis (2005) doi | Excluded | No sensory bitterness in the abstract (full text stopped at a verification screen) |
| Relationship between MALDI-TOF analysis of beta-CN f193-209 concentration and sensory evaluation of bitterness intensity of aged cheddar cheese (2002) doi | Read as context (not in the table) | Correlations of a peptide with bitterness at 180 and 270 days (r=0.803, 0.554), not a result on bitterness differences with ripening time; abstract only |
| Identification of bitter peptides in aged cheddar cheese (2014) doi | Read as context (not in the table) | Identification of bitter peptides in aged Cheddar; abstract only |
| Sensomics mapping and identification of the key bitter metabolites in Gouda cheese (2008) doi | Read as context (not in the table) | Identification and thresholds of Gouda bitter compounds; not a comparison of conditions; abstract only |
| Bitterness in Cheese: A Review (1996) doi | Read as context (not in the table) | Review; abstract only, which does not name the studies covered |
Read in the encyclopedia
- Cheese — the food in this question
- Bitter peptides — the candidate compounds
- Fermentation and bitter peptides — the fermentation topic hub
- Is finding broccoli, kale and other brassicas bitter down to a gene (TAS2R38)? — a comparison page in the same format
Source ledger
Each study's source can be reached from its section above. All of the lab's sources are listed in the source ledger.
How to cite this page
Aoki, M. (NIGAMI LAB) (2026). Does starter or ripening change cheese bitterness?. https://nigamilab.com/en/topics/cheese-starter-ripening/
Each claim card has a stable anchor (#clm-…). The dataset is CC BY 4.0; see the data page. Dataset DOI: 10.5281/zenodo.22739101