Topic hub — 2026-10-21
Which compounds set the bitterness of extra virgin olive oil?
A caveat first: this page is about bitterness tasted on the tongue, kept apart from the peppery sting in the throat (pungency), which is a different sensation. The two tend to rise together in the same oils but are rated as separate attributes. When extra virgin olive oil tastes bitter, phenolic compounds are usually named as the cause. What do studies that set bitterness scores against phenolic compounds in the same oils say? This page lines up the included studies together with their conditions: cultivar and origin, growing and milling, and who rated the oils on what scale. Where studies disagree about which compounds carry the bitterness, the disagreement is left as it is. It then separates what was established within one experiment, what differences between studies might explain, and what this comparison alone cannot separate. It is about perceived bitterness and composition, not oil quality or health effects.
On this page (10 sections)
- What this page establishes
- What the included studies allow us to say
- Bitterness ratings at a glance
- Conditions and results, study by study
- What was established within an experiment
- Candidate explanations for the differences
- What is not known — what this comparison alone cannot separate
- How studies and rows were counted
- What we looked at
- Read in the encyclopedia
What this page establishes
- That oils with more total phenols tend to be more bitter, but the total alone has limits for explaining or predicting bitterness.
- That there are cases where bitterness fell while total phenols decreased only slightly, and where total phenols differed without a detected bitterness difference.
- That some studies place ligstroside and oleuropein aglycones on the more bitter side, while oleocanthal gives separate results for bitterness and for throat pungency.
- That bitterness and throat pungency are rated separately but move together in the same oils, making it hard to separate which one a compound affects.
What the included studies allow us to say
- Oils with more total phenols tend to be more bitter, but that alone does not decide it. Among 200 top oils, the robust-bitterness class had 621 mg/kg of total phenols and the delicate class 327, with a correlation of R=0.46; other studies report r=0.69 and R²=0.52, so the total alone has limits for explaining or predicting bitterness. [rows: Tomé-Rodríguez 2025 Robust vs delicate bitterness; Pedan 2019 Bitterness vs pungency (correlation with total phenols); Calatayud 2024 Relationship with total phenols]
- There are also cases where amounts and bitterness do not line up: leaving the same oil to settle for 3 months lowered bitterness from 4.8 to 3.2 while total phenols fell only 3% (773 to 750 mg/kg), and 2 groups with different total phenols (306.00 vs 208.36 mg/kg) showed no detected bitterness difference (2.40). Among individual compounds, the top-oil study and an abstract-only study place ligstroside and oleuropein aglycones on the more bitter side. [rows: Ciafardini 2022 90 vs 0 days of settling; Ghorbel 2025 Extra virgin vs virgin; Tomé-Rodríguez 2025 Robust vs delicate bitterness; Gutiérrez-Rosales 2003 Aglycone concentrations]
Bitterness ratings at a glance
Human bitterness ratings. Values for "Group compared" and "Comparison" are as reported in the tables or text (values shown only in figures are marked as such). Rows comparing compound amounts between more and less bitter classes, rows on bitterness under different growing or milling conditions, and rows on pungency are kept apart. For studies read only as abstracts, only what the abstract states is shown. "Direction" shows which sample was more bitter; whether the difference is significant is shown by the test in the same "Direction / test" column. Select a study name to jump to its detailed table.
Results in which people rated bitterness only. Where each value comes from (a table or a reading from a figure) is shown in its row; scales and methods differ between studies, so compare within a row, not across rows.
| Study | Comparison and condition | Measured as | Sample compared | Comparison | Direction / test |
|---|---|---|---|---|---|
| Tomé-Rodríguez 2025 | Bitterness scores of the 3 classes Mean of median bitterness in classes defined by the EU categories: delicate (below 3.0), medium and robust (above 6.0) (2 harvests) | mean of medians on 0–10 (5 assessors per oil) | 6.32, 6.86 (robust) | 2.57, 2.86 (delicate) | Sample compared more bitter No test reported |
| Pedan 2019 | Bitterness vs pungency (correlation with total phenols) Across 100 oils, correlation of bitterness and of pungency with total phenols | correlation coefficient (100 oils) | r=0.69 (bitterness) | r=0.54 (pungency) | Sample compared higher No test reported |
| Antonelli 2024 | Frozen vs fresh fruit Oil from fruit frozen before milling vs oil from fresh fruit | IOC-method scores (9 assessors) | not significantly different (values only in a figure) | values only in a figure | Direction not given Tested, not significant |
| Brkić Bubola 2022 | Irrigated vs rain-fed 3 irrigated treatments vs rain-fed (2 years) | 0–10 scale (8 assessors) | lower (values only in a figure) | values only in a figure | Comparison more bitter Tested, only some pairs significant |
| Sánchez-Rodríguez 2019 | Deficit irrigation T1 vs control 58% water reduction vs control | mean on 0–10 (8 assessors) | 0.5 | 0.8 | Comparison more bitter Tested, significant |
| Ciafardini 2022 | 90 vs 0 days of settling The same oil left to settle for 3 months | 0–5 descriptive scale | 3.2 | 4.8 | Comparison more bitter Tested, significant |
| Peralta 2024 | 30 vs 15 min malaxation Runs with 15 and 30 minutes of malaxation (on different days and batches, also differing in temperature and fruit oil content) | median (8 assessors) | 3.4, 3.2 | 2.7, 2.6 | Sample compared more bitter Tested, significant |
| Ghorbel 2025 | Extra virgin vs virgin 2 Tunisian groups (18 oils each) | median (8 assessors) | 2.40 | 2.40 | Direction not given Tested, not significant |
| Calatayud 2024 | Relationship with total phenols Across 230 oils, bitterness and total phenols | coefficient of determination (230 oils) | R²=0.52 | not applicable (strength of relationship) | Direction not given No test reported |
| Gutiérrez-Rosales 2003 | Aglycone concentrations Across 20 oils, regression of bitterness on aglycone concentrations | not given (not in the abstract) | linked to bitterness (abstract wording) | values not in the abstract | Direction not given No test reported |
| Favati 2013 | K225 and total phenols K225 and total phenols compared as predictors of bitterness | not given (not in the abstract) | K225 predicted well (abstract wording) | values not in the abstract | Direction not given No test reported |
Conditions and results, study by study
For each study, the conditions for the oils, growing or milling and who rated them, and the results. Each row is one study × one measured result, so different comparisons in the same study are separate rows. Under each row we give where it is in the paper and whether it can be used to judge whether the bitterness people perceive corresponds to the amounts of phenolic compounds in the same oils, with the reason. Nothing is left blank: "not given", "not read" and "not applicable" are kept apart.
Tomé-Rodríguez 2025 sensory + composition
Phenolic Metabolism Explains Bitterness and Pungency of Extra Virgin Olive Oils. Foods 14(9):1620 — doi:10.3390/foods14091620
- How deeply checked
- Checked in full text — Full text via Europe PMC (sections 3.1–3.4, Tables 1–4, Figs 1–3); the individual correlation table (Supplementary Table S4) was not read Checked by: LLM (one extracted, another checked against the source; no human check), 2026-10-21.
- Samples
- 200 top-ranked EVOOs from a Spanish competition (100 in each of 2 harvests; single-cultivar and blends), skewed towards high-quality oils without defects
- Processing and cooking
- Not given (cultivar and ripeness in a supplementary table)
- How it was served or eaten
- Not given (not read for this table)
- Who rated, on what scale
- For each oil 5 assessors from the competition panel rated bitterness and pungency separately on 0–10 by the IOC method (values are medians); oils grouped into delicate, medium and robust bitterness; compounds measured in the same oils by LC-MS/MS
| Measured | Comparison and condition | Sample compared | Comparison | Unit | Direction / test |
|---|---|---|---|---|---|
| Bitterness intensity (sensory) | Bitterness scores of the 3 classes Mean of median bitterness in classes defined by the EU categories: delicate (below 3.0), medium and robust (above 6.0) (2 harvests) | 6.32, 6.86 (robust) | 2.57, 2.86 (delicate) | mean of medians on 0–10 (5 assessors per oil) | Sample compared more bitter No test reported |
| The classes were defined by the scores, so a test between them is not meaningful; the medium class was 4.42, 4.99. Class sizes were 32 delicate, 140 medium and 26 robust (198 in all; the gap from 200 is not explained). 2022/23 was more bitter (p<0.001), though total phenols averaged 437 mg/kg in both years Where: Section 3.1; Table 1 For whether the bitterness people perceive corresponds to the amounts of phenolic compounds in the same oils: Limited — Oils grouped into 3 classes by bitterness score, the basis for comparing compounds between classes | |||||
| Total phenols | Robust vs delicate bitterness Total phenols in the robust (26 oils) and delicate (32 oils) bitterness classes | 621±223 | 327±144 | mean±SD, mg/kg (by bitterness class) | Sample compared higher Tested, significant |
| The medium class was 428±153, with differences among the 3 classes; Spearman correlation of bitterness with total phenols R=0.46; ROC AUC for delicate vs robust 88.3. The authors note that all correlations were below 0.5 and that several compounds are involved Where: Sections 3.1, 3.3, 3.4; Tables 3 and 4 For whether the bitterness people perceive corresponds to the amounts of phenolic compounds in the same oils: Limited — Bitterness and compounds measured in the same oils, but observationally, not by changing compounds; skewed towards top oils | |||||
| Ligstroside aglycone | Robust vs delicate bitterness Ligstroside aglycone in the robust and delicate bitterness classes | 121±64 | 50.8±30.3 | mean±SD, mg/kg (by bitterness class) | Sample compared higher Tested, significant |
| Differences among all 3 classes; oleuropein aglycone ran the same way (190±82 vs 93.3±55.4). AUC for delicate vs robust was 88.3 for ligstroside aglycone and 86.2 for oleuropein aglycone; the authors name these 2 as most strongly linked to bitterness Where: Sections 3.3, 3.4; Tables 3 and 4 For whether the bitterness people perceive corresponds to the amounts of phenolic compounds in the same oils: Limited — Observational measurements in the same oils; compounds move together, so which one matters cannot be separated | |||||
| Oleocanthal | Robust vs delicate bitterness Oleocanthal in the robust and delicate bitterness classes | 75.6±50.9 | 51.5±33.5 | mean±SD, mg/kg (by bitterness class) | Sample compared higher Tested, not significant |
| In Table 3 the class letters are a for robust and ab for delicate, so robust vs delicate is not shown as significant (robust and medium differ). Oleacein (68.6 vs 37.8) had no difference marks. The authors place oleocanthal and oleacein on the low-bitterness side in a multivariate analysis, but the class means are numerically larger in the more bitter class; AUC across the 3 bitterness classes was 59.9 for oleocanthal Where: Sections 3.3, 3.4; Tables 3 and 4; Fig. 1 For whether the bitterness people perceive corresponds to the amounts of phenolic compounds in the same oils: Limited — Observational; the authors' interpretation (low-bitterness side) and the class means (higher in the more bitter class) point different ways | |||||
| Total phenols | Robust vs medium pungency (total phenols) Total phenols in the robust and medium pungency classes (the delicate class had only 11 oils and was left out of the ROC comparison) | 522±189 | 422±175 | mean±SD, mg/kg (by pungency class) | Sample compared higher Tested, significant |
| Individual compounds differing between pungency classes were oleomissional (p=0.0015), oleocoronal (p=0.05) and oleocanthal (p=0.021); bitterness and pungency scores correlated at R=0.69 Where: Sections 3.1, 3.3; Table 3 For whether the bitterness people perceive corresponds to the amounts of phenolic compounds in the same oils: Not usable — A comparison of compounds by pungency class, not of bitterness | |||||
Pedan 2019 sensory only
Characterization of Phenolic Compounds and Their Contribution to Sensory Properties of Olive Oil. Molecules — doi:10.3390/molecules24112041
- How deeply checked
- Checked in full text — Full text via Europe PMC (sections 2.1–2.3, Table 1, Figs 5 and 6); supplementary material not read Checked by: LLM (one extracted, another checked against the source; no human check), 2026-10-21.
- Samples
- 100 EVOOs entered in a Zurich competition (8 countries plus blends; the text itemises 62 single-cultivar and 35 blends)
- Processing and cooking
- Not given (ripeness classed as green, green-to-ripe or ripe from sensory impression)
- How it was served or eaten
- Not given (not read for this table)
- Who rated, on what scale
- A trained panel rated bitterness, pungency and fruitiness separately on 0–10 (panel size not given); total phenols by Folin-Ciocalteu, individual compounds by LC-DAD-MS
| Measured | Comparison and condition | Sample compared | Comparison | Unit | Direction / test |
|---|---|---|---|---|---|
| Bitterness–compound relationship (correlation) | Bitterness vs pungency (correlation with total phenols) Across 100 oils, correlation of bitterness and of pungency with total phenols | r=0.69 (bitterness) | r=0.54 (pungency) | correlation coefficient (100 oils) | Sample compared higher No test reported |
| The type of correlation and its test are not stated; the abstract gives r=0.72 for bitterness and total phenols, conflicting with the text. The first 2 principal components explain only 36.5%, and the authors write that the relationship is not simply linear Where: Section 2.1; Abstract For whether the bitterness people perceive corresponds to the amounts of phenolic compounds in the same oils: Limited — Correlation of bitterness with total phenols in the same oils; test and type not stated, and the value differs between abstract and text | |||||
Antonelli 2024 sensory only
The Management of Irrigation and Potassium Fertilization to Mitigate the Effect of Light Frosts on the Phenolic and Volatile Compounds in Virgin Olive Oils. Antioxidants 13(5), article 559 — doi:10.3390/antiox13050559
- How deeply checked
- Checked in full text — Full text via Europe PMC (sections 3.1.2, 3.1.5, 3.2.3, 3.3; Figs 1, 4, 7; Table 5) Checked by: LLM (one extracted, another checked against the source; no human check), 2026-10-21.
- Samples
- Chilean Arbequina: 15 irrigation, potassium and copper treatments, 3 harvests, oils from fresh fruit and from fruit frozen at −3 °C for 12 h; 180 oils in all
- Processing and cooking
- Fruit frozen or not before milling
- How it was served or eaten
- 15 mL in a standard blue glass
- Who rated, on what scale
- 9 assessors trained in the IOC method rated bitterness and pungency separately (scale range not given); compounds by HPLC in the same oils
| Measured | Comparison and condition | Sample compared | Comparison | Unit | Direction / test |
|---|---|---|---|---|---|
| Bitterness intensity (sensory) | Frozen vs fresh fruit Oil from fruit frozen before milling vs oil from fresh fruit | not significantly different (values only in a figure) | values only in a figure | IOC-method scores (9 assessors) | Direction not given Tested, not significant |
| Freezing significantly reduced total phenols and secoiridoids (except total phenols in July), but bitterness and pungency scores did not differ significantly from fresh-fruit oil; the abstract says frozen-fruit oil was more pungent, conflicting with the text Where: Sections 3.1.5, 3.2.3; Fig. 4 For whether the bitterness people perceive corresponds to the amounts of phenolic compounds in the same oils: Limited — Freezing reduced compounds but bitterness did not change significantly; usable as a case where amounts and bitterness do not line up | |||||
Brkić Bubola 2022 sensory only
Effect of Different Watering Regimes on Olive Oil Quality and Composition of Coratina Cultivar Olives Grown on Karst Soil in Croatia. Foods 11(12), article 1767 — doi:10.3390/foods11121767
- How deeply checked
- Checked in full text — Full text via Europe PMC (sections 3.2.5, 3.2.6; Table 7; Fig. 4); bitterness values only in Fig. 4, which was not viewed Checked by: LLM (one extracted, another checked against the source; no human check), 2026-10-21.
- Samples
- Croatian Coratina: rain-fed and 3 irrigation treatments over 2 years, 3 oils per treatment (24 in all)
- Processing and cooking
- Irrigation regime (rain-fed, empirical deficit, stage-based deficit, 100%)
- How it was served or eaten
- Not given (not read for this table)
- Who rated, on what scale
- 8 assessors of an IOC-recognised panel on a 0–10 scale, bitterness and pungency separately; compounds by HPLC-DAD in the same oils
| Measured | Comparison and condition | Sample compared | Comparison | Unit | Direction / test |
|---|---|---|---|---|---|
| Bitterness intensity (sensory) | Irrigated vs rain-fed 3 irrigated treatments vs rain-fed (2 years) | lower (values only in a figure) | values only in a figure | 0–10 scale (8 assessors) | Comparison more bitter Tested, only some pairs significant |
| Irrigation slightly lowered bitterness in 2019 and lowered it non-significantly in 2020; bitterness and pungency of the rain-fed oil exceeded 6 (irrigated values only in the figure). Total phenols did not differ significantly among the 4 treatments in either year (2019: rain-fed 1311.8, irrigated 1043.3–1077.9 mg/kg) Where: Sections 3.2.5, 3.2.6; Table 7; Fig. 4 For whether the bitterness people perceive corresponds to the amounts of phenolic compounds in the same oils: Limited — Irrigation lowered bitterness slightly while total phenols did not change significantly; bitterness values only in a figure | |||||
Sánchez-Rodríguez 2019 sensory only
Quality Attributes and Fatty Acid, Volatile and Sensory Profiles of "Arbequina" hydroSOStainable Olive Oil. Molecules 24(11), article 2148 — doi:10.3390/molecules24112148
- How deeply checked
- Checked in full text — Full text via Europe PMC (Tables 1 and 4, Fig. 1) Checked by: LLM (one extracted, another checked against the source; no human check), 2026-10-21.
- Samples
- Spanish Arbequina: control and 3 deficit-irrigation treatments (2017)
- Processing and cooking
- Irrigation regime (control and 3 reduced-water regimes)
- How it was served or eaten
- Not given (not read for this table)
- Who rated, on what scale
- 8 laboratory assessors (over 600 hours of training) in descriptive analysis on 0–10, rating bitterness, pungency and astringency separately; only total phenols measured
| Measured | Comparison and condition | Sample compared | Comparison | Unit | Direction / test |
|---|---|---|---|---|---|
| Bitterness intensity (sensory) | Deficit irrigation T1 vs control 58% water reduction vs control | 0.5 | 0.8 | mean on 0–10 (8 assessors) | Comparison more bitter Tested, significant |
| By ANOVA only T1 differed from the others; total phenols were 126.8 for T1 and 259.8 for the control. Elsewhere they did not line up: T3, the most bitter (0.9), had 181.5, while T2 with the most total phenols (267.3) scored 0.7. No correlation between bitterness and total phenols is reported (total phenols as gallic acid equivalents in mg/L); bitterness was below 1 in every treatment Where: Tables 1 and 4 For whether the bitterness people perceive corresponds to the amounts of phenolic compounds in the same oils: Limited — Only total phenols measured, and treatment rankings do not match bitterness; no correlation computed | |||||
Ciafardini 2022 sensory only
Microbiological and Enzymatic Activity Modulates the Bitter Taste Reduction in Decanted Coratina Olive Oil. Foods 11(6):867 — doi:10.3390/foods11060867
- How deeply checked
- Checked in full text — Full text via Europe PMC (section 3.4; Tables 1, 6, 7) Checked by: LLM (one extracted, another checked against the source; no human check), 2026-10-21.
- Samples
- New Coratina oil from Italy held in 3 tanks of 200 L under nitrogen
- Processing and cooking
- Left to settle for 3 months (racked monthly); the authors attribute breakdown of bitter compounds to enzymes and yeasts in the oil
- How it was served or eaten
- Not given (not read for this table)
- Who rated, on what scale
- A nationally recognised panel (size not given); bitterness on a 0–5 descriptive scale, pungency separately; total phenols (HPLC, tyrosol equivalents) and K225, an absorbance index at 225 nm
| Measured | Comparison and condition | Sample compared | Comparison | Unit | Direction / test |
|---|---|---|---|---|---|
| Bitterness intensity (sensory) | 90 vs 0 days of settling The same oil left to settle for 3 months | 3.2 | 4.8 | 0–5 descriptive scale | Comparison more bitter Tested, significant |
| 30 days (4.6) was not significant; bitterness fell by 60 and 90 days. Total phenols went from 773 to 750 mg/kg as tyrosol equivalents (3% down, a significant difference) and K225 from 0.757 to 0.668; pungency went from 4.0 to 3.7, not a significant change Where: Section 3.4; Tables 1, 6, 7 For whether the bitterness people perceive corresponds to the amounts of phenolic compounds in the same oils: Limited — Bitterness fell in the same oil while total phenols barely changed; individual compound values not reported | |||||
Peralta 2024 sensory only
Olive Oil (Royal Cultivar) from Mill Obtained by Short Time Malaxation and Early Ripening Stage. Foods 13(16):2588 — doi:10.3390/foods13162588
- How deeply checked
- Checked in full text — Full text via Europe PMC (sections 3.3, 3.5; Tables 4 and 6) Checked by: LLM (one extracted, another checked against the source; no human check), 2026-10-21.
- Samples
- Early-harvest Royal oil (ripeness index about 1.05) from a Spanish mill; 1 industrial run per condition
- Processing and cooking
- 2 industrial runs with 15 and 30 minutes of malaxation (on different days and batches, also differing in temperature and fruit oil content)
- How it was served or eaten
- Not applicable (oils assessed as produced)
- Who rated, on what scale
- 8 experts at an accredited laboratory, rating bitterness, pungency and fruitiness separately; compounds by HPLC in the same oils
| Measured | Comparison and condition | Sample compared | Comparison | Unit | Direction / test |
|---|---|---|---|---|---|
| Bitterness intensity (sensory) | 30 vs 15 min malaxation Runs with 15 and 30 minutes of malaxation (on different days and batches, also differing in temperature and fruit oil content) | 3.4, 3.2 | 2.7, 2.6 | median (8 assessors) | Sample compared more bitter Tested, significant |
| Bitterness p=0.0243; pungency 3.9, 3.9 vs 3.5, 3.6, not significant (p=0.1091). Total phenols as tyrosol equivalents were 156.38, 138.86 vs 105.54, 96.99 mg/kg; the compound labelled oleacein was 53.33, 48.42 vs 20.48, 25.61 and oleocanthal 28.71, 24.48 vs 18.45, 17.08, while p-HPEA-EA was about the same. Fruit oil content was 14.33 vs 13.52% (p=0.0006); one industrial run per condition Where: Sections 3.3, 3.5; Tables 4 and 6 For whether the bitterness people perceive corresponds to the amounts of phenolic compounds in the same oils: Limited — Runs with different malaxation times saw total phenols and bitterness rise together, but on different days and batches with differing temperature and fruit oil content, 1 run each | |||||
Ghorbel 2025 sensory only
Chemical and Sensory Characteristics of Olive Oils Extracted from the Tunisian Olive Varieties. ACS Omega 10(16):16579-16588 — doi:10.1021/acsomega.4c11690
- How deeply checked
- Checked in full text — Full text via Europe PMC (Tables 1, 2, 4) Checked by: LLM (one extracted, another checked against the source; no human check), 2026-10-21.
- Samples
- 36 Tunisian oils (18 virgin, 18 extra virgin); the 2 groups differ in origin and cultivar mix, and the virgin group includes oils with defects
- Processing and cooking
- Malaxed at 25 °C and extracted by decanter; stored in the dark at 4 °C until analysis
- How it was served or eaten
- Not given (not read for this table)
- Who rated, on what scale
- 8 assessors of a national panel by the IOC method, bitterness and pungency separately; only total phenols and 3 compounds measured (no aglycones)
| Measured | Comparison and condition | Sample compared | Comparison | Unit | Direction / test |
|---|---|---|---|---|---|
| Bitterness intensity (sensory) | Extra virgin vs virgin 2 Tunisian groups (18 oils each) | 2.40 | 2.40 | median (8 assessors) | Direction not given Tested, not significant |
| Bitterness not significantly different (p=0.999; which does not mean the same), while median total phenols as caffeic acid equivalents differed significantly (306.00 vs 208.36 mg/kg, p=0.014), as did oleuropein (235.46 vs 49.57, p=0.046). The groups differ in origin and cultivar, the virgin group includes oils with defects, and aglycones were not measured Where: Tables 2 and 4 For whether the bitterness people perceive corresponds to the amounts of phenolic compounds in the same oils: Limited — A case where total phenols differed without a significant bitterness difference, but the 2 groups also differ in origin, cultivar and defects | |||||
Calatayud 2024 sensory only
Relationships Between Chemical Compounds and Sensory Properties of Virgin Olive Oil in the US and Israel: Development of a Prediction Model for Defects. Journal of Agricultural and Food Chemistry 72(45):25391-25402 — doi:10.1021/acs.jafc.4c06012
- How deeply checked
- Checked in full text — Full text via Europe PMC (text, Figs 1 and 2, values cited from Supplementary Table S1); correlation values only in figures, which were not viewed Checked by: LLM (one extracted, another checked against the source; no human check), 2026-10-21.
- Samples
- 230 oils from the US and Israel, including oils with deliberately induced defects (the main aim was defect prediction)
- Processing and cooking
- Varies by sample (including laboratory-milled oils, oils stored at different temperatures and oils with induced defects)
- How it was served or eaten
- Not given (not read for this table)
- Who rated, on what scale
- 2 panels (IOC- and AOCS-recognised) by the IOC method (sizes not given), bitterness and pungency separately; total and individual phenols
| Measured | Comparison and condition | Sample compared | Comparison | Unit | Direction / test |
|---|---|---|---|---|---|
| Bitterness–compound relationship (correlation) | Relationship with total phenols Across 230 oils, bitterness and total phenols | R²=0.52 | not applicable (strength of relationship) | coefficient of determination (230 oils) | Direction not given No test reported |
| The text gives R²=0.52 as a value from Supplementary Table S1 (the table itself was not seen); no p-value for it is given. The text names hydroxytyrosol, forms of ligstroside aglycone and pinoresinol as correlating with bitterness, and in the same paragraph says forms of oleuropein aglycone also correlate with it. Many oils with defects are included Where: Text; Fig. 1 (value cited from Supplementary Table S1) For whether the bitterness people perceive corresponds to the amounts of phenolic compounds in the same oils: Limited — Strength of the bitterness–total phenol relationship, with many defective oils included | |||||
Gutiérrez-Rosales 2003 sensory only
Main polyphenols in the bitter taste of virgin olive oil. Structural confirmation by on-line high-performance liquid chromatography electrospray ionization mass spectrometry. Journal of Agricultural and Food Chemistry 51(20):6021-6025 — doi:10.1021/jf021199x
- How deeply checked
- Abstract only — Abstract only (full text paywalled) Checked by: LLM (one extracted, another checked against the source; no human check), 2026-10-21.
- Samples
- 20 high-quality virgin oils differing in bitterness
- Processing and cooking
- Not given (not in the abstract)
- How it was served or eaten
- Not given (not in the abstract)
- Who rated, on what scale
- Relationship between assessors' bitterness intensity and aglycone concentrations analyzed by linear regression (the abstract's wording is garbled, so the direction of the regression is unclear; panel size and scale not in the abstract)
| Measured | Comparison and condition | Sample compared | Comparison | Unit | Direction / test |
|---|---|---|---|---|---|
| Bitterness intensity (sensory) | Aglycone concentrations Across 20 oils, regression of bitterness on aglycone concentrations | linked to bitterness (abstract wording) | values not in the abstract | not given (not in the abstract) | Direction not given No test reported |
| The abstract concludes that forms of oleuropein and ligstroside aglycone play an essential role in bitterness; values and tests not in the abstract Where: Abstract For whether the bitterness people perceive corresponds to the amounts of phenolic compounds in the same oils: Limited — The abstract reports regressing bitterness on aglycones, but values and panel were not checked in full text | |||||
Favati 2013 sensory only
Extra virgin olive oil bitterness evaluation by sensory and chemical analyses. Food Chemistry 139(1-4):949-954 — doi:10.1016/j.foodchem.2013.01.098
- How deeply checked
- Abstract only — Abstract only (full text paywalled) Checked by: LLM (one extracted, another checked against the source; no human check), 2026-10-21.
- Samples
- Blended and single-cultivar EVOOs (Coratina, Leccino, Maiatica, Ogliarola)
- Processing and cooking
- Not given (not in the abstract)
- How it was served or eaten
- Not given (not in the abstract)
- Who rated, on what scale
- Panel bitterness compared with total phenols and absorbance at 225 nm (K225) (panel size and scale not in the abstract)
| Measured | Comparison and condition | Sample compared | Comparison | Unit | Direction / test |
|---|---|---|---|---|---|
| Bitterness intensity (sensory) | K225 and total phenols K225 and total phenols compared as predictors of bitterness | K225 predicted well (abstract wording) | values not in the abstract | not given (not in the abstract) | Direction not given No test reported |
| The abstract states that K225 predicted bitterness intensity well; values and tests not in the abstract Where: Abstract For whether the bitterness people perceive corresponds to the amounts of phenolic compounds in the same oils: Limited — The abstract reports predicting bitterness from K225, but values were not checked in full text | |||||
Andrewes 2003 sensory only
Sensory properties of virgin olive oil polyphenols: identification of deacetoxy-ligstroside aglycon as a key contributor to pungency. Journal of Agricultural and Food Chemistry 51(5):1415-1420 — doi:10.1021/jf026042j
- How deeply checked
- Abstract only — Abstract only (full text paywalled) Checked by: LLM (one extracted, another checked against the source; no human check), 2026-10-21.
- Samples
- Phenolic extract from oil separated into HPLC fractions
- Processing and cooking
- Not applicable (fractions were tasted)
- How it was served or eaten
- Not given (not in the abstract; only that fractions were tasted)
- Who rated, on what scale
- Bitterness, astringency and throat burn described for each fraction (panel size not in the abstract)
| Measured | Comparison and condition | Sample compared | Comparison | Unit | Direction / test |
|---|---|---|---|---|---|
| Pungency (throat irritation, sensory) | Sensation by fraction Phenolic fractions tasted | strong burn at the back of the throat (deacetoxy ligstroside aglycone fraction; abstract) | weak burn on the tongue (deacetoxy oleuropein aglycone fraction) | not given (not in the abstract) | Sample compared higher No test reported |
| The abstract says most fractions were bitter and astringent, and only the deacetoxy ligstroside aglycone fraction (the compound later called oleocanthal) produced a strong throat burn; at the same concentration another fraction gave only a weak burn on the tongue Where: Abstract For whether the bitterness people perceive corresponds to the amounts of phenolic compounds in the same oils: Not usable — Separates the compound producing pungency (throat irritation); not a comparison of bitterness intensity | |||||
What was established within an experiment
Only results where the same panel compared changed conditions within one study.
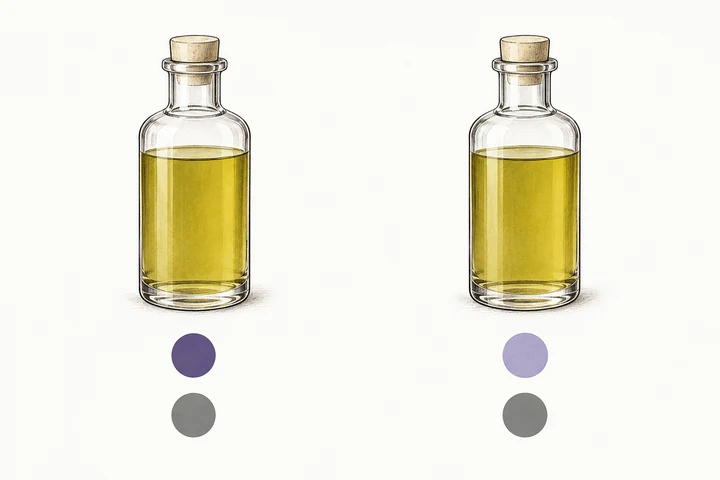
- In the same oil left to settle, bitterness fell from 4.8 to 3.2 (significant by 60 and 90 days) while total phenols decreased only 3% (773 to 750 mg/kg) and no significant change in pungency (4.0 to 3.7) was detected. [rows: Ciafardini 2022 90 vs 0 days of settling]
- With the same cultivar, the 30-minute malaxation run was more bitter than the 15-minute run (3.4, 3.2 vs 2.7, 2.6, p=0.0243), with more total phenols (156.38, 138.86 vs 105.54, 96.99 mg/kg); no significant difference in pungency was detected (p=0.1091). The 2 runs also differed in day, batch and temperature. [rows: Peralta 2024 30 vs 15 min malaxation]
- Freezing the fruit before milling significantly reduced total phenols and secoiridoids (except total phenols at the last harvest), but no significant difference in bitterness or pungency scores from fresh-fruit oil was detected. [rows: Antonelli 2024 Frozen vs fresh fruit]
Freshly pressed
After 3 months
Upper purple mark: bitterness / lower grey mark: total phenols
A study in which the same oil was stored for three months under nitrogen, with the sediment drawn off every month. Bitterness fell, while total phenols fell only slightly. The grey marks are drawn in the same shade as a rough grouping of close values; this does not mean equal values, no change, or no significant difference. The purple and grey marks are on different scales and are not compared with each other. Do not read this as oil simply left in a kitchen, or as the effect of removing sediment alone. The bottles are drawn for explanation and show no difference in the oil's appearance. The purple and grey are not real colours.
Source: Ciafardini and Zullo 2022 (Ciafardini 2022 in the table of conditions and results by study)
Illustration: illustration desk (PurpleHeron)
Candidate explanations for the differences
Conditions that differ between studies, or between samples, and could explain differences in bitterness. Several conditions differ at once, so which one mattered is unknown. These are candidates, not causes.
- The candidates most often named for bitterness are ligstroside and oleuropein aglycones: in top oils they were higher in the robust class (121 vs 50.8 and 190 vs 93.3 mg/kg), with AUCs of 88.3 and 86.2 for delicate vs robust, and an abstract-only study also reports regressing bitterness on these forms. These are observations; adding the compounds to see whether bitterness rises was not tested. [rows: Tomé-Rodríguez 2025 Robust vs delicate bitterness; Gutiérrez-Rosales 2003 Aglycone concentrations]
- For oleocanthal, bitterness and throat pungency give separate results. On bitterness, the authors of the top-oil study place it on the low-bitterness side in a multivariate analysis, yet its class means are numerically the other way (75.6 robust vs 51.5 delicate), and this difference is not shown as significant. On pungency, an abstract-only study reports that its fraction produced a strong throat burn, and it differed between pungency classes (p=0.021). Its link to bitterness and its contribution to throat pungency are separate questions. [rows: Tomé-Rodríguez 2025 Robust vs delicate bitterness; Andrewes 2003 Sensation by fraction; Tomé-Rodríguez 2025 Robust vs medium pungency (total phenols)]
What is not known — what this comparison alone cannot separate
- Between studies the cultivars, origins, ripeness, panels, scales (0–10, 0–5) and methods for total phenols differ, so how many mg/kg give how much bitterness cannot be compared side by side. Bitterness and pungency are rated as separate attributes but move together in the same oils (R=0.69), making it hard to separate which a compound affects. [rows: Tomé-Rodríguez 2025 Robust vs delicate bitterness; Tomé-Rodríguez 2025 Robust vs medium pungency (total phenols); Ciafardini 2022 90 vs 0 days of settling]
- No included study directly tested in oil which compounds, when added or removed, change bitterness. With a case where bitterness fell while the total decreased only slightly (settling) and one where totals differed without a detected bitterness difference (the 2-group comparison), the total alone does not explain it. [rows: Ciafardini 2022 90 vs 0 days of settling; Ghorbel 2025 Extra virgin vs virgin]
How studies and rows were counted
The number of evidence rows is not the number of studies. Table rows, ledger evidence rows, papers and research groups are counted separately.
- Sources in the table: 12, of which 11 have results on people's bitterness ratings in this table; for the others, only results on something else (compounds, smell) are shown, or they are used only for context.
- Rows in the table (study × measured result): 16. Rows on perceived bitterness: 11.
- Evidence rows in the lab's ledger these rows rest on: 0. One paper can supply several rows. Rows without a ledger evidence row come from other tables of the same papers, or from sources newly read for this question.
- Research groups among the studies with bitterness results in this table, as grouped in the ledger: 11 (reports from the same lab count as 1; co-authors and affiliations can overlap, so this is not a count of independent replications).
What we looked at
The sources examined for this question, why each was included or excluded, and which full texts could not be reached. We searched Europe PMC for studies in which people rated olive oil bitterness and phenolic compounds were measured in the same oils, and added the sources already in the lab's ledger (J-STAGE and CiNii were not searched). Paywalled studies are marked as read from the abstract only.
| Source | Decision | Why |
|---|---|---|
| Phenolic Metabolism Explains Bitterness and Pungency of Extra Virgin Olive Oils (2025) doi | Included in the table | Bitterness and pungency separated, with individual phenols in the same oils; read in full |
| Characterization of Phenolic Compounds and Their Contribution to Sensory Properties of Olive Oil (2019) doi | Included in the table | Correlations of bitterness and pungency with total phenols; read in full |
| The Management of Irrigation and Potassium Fertilization to Mitigate the Effect of Light Frosts on the Phenolic and Volatile Compounds in Virgin Olive Oils (2024) doi | Included in the table | Compounds fell with freezing without a detected bitterness difference; read in full |
| Effect of Different Watering Regimes on Olive Oil Quality and Composition of Coratina Cultivar Olives Grown on Karst Soil in Croatia (2022) doi | Included in the table | Irrigation, bitterness and total phenols; read in full |
| Quality Attributes and Fatty Acid, Volatile and Sensory Profiles of "Arbequina" hydroSOStainable Olive Oil (2019) doi | Included in the table | Deficit irrigation, bitterness and total phenols; read in full |
| Microbiological and Enzymatic Activity Modulates the Bitter Taste Reduction in Decanted Coratina Olive Oil (2022) doi | Included in the table | Settling lowered bitterness with little change in total phenols; read in full |
| Olive Oil (Royal Cultivar) from Mill Obtained by Short Time Malaxation and Early Ripening Stage (2024) doi | Included in the table | Malaxation time, bitterness and compounds; read in full |
| Chemical and Sensory Characteristics of Olive Oils Extracted from the Tunisian Olive Varieties (2025) doi | Included in the table | 2 groups differing in total phenols without a detected bitterness difference; read in full |
| Relationships Between Chemical Compounds and Sensory Properties of Virgin Olive Oil in the US and Israel: Development of a Prediction Model for Defects (2024) doi | Included in the table | Bitterness and total phenols across 230 oils; read in full |
| Main polyphenols in the bitter taste of virgin olive oil. Structural confirmation by on-line high-performance liquid chromatography electrospray ionization mass spectrometry (2003) doi | Included in the table | Regression of bitterness on aglycones; abstract only |
| Extra virgin olive oil bitterness evaluation by sensory and chemical analyses (2013) doi | Included in the table | Predicting bitterness from K225; abstract only |
| Sensory properties of virgin olive oil polyphenols: identification of deacetoxy-ligstroside aglycon as a key contributor to pungency (2003) doi | Included in the table | Fractions separating the compound behind pungency; abstract only |
| Bitter taste and phenolic compounds in extra virgin olive oil: an empirical relationship (2006) doi | Read as context (not in the table) | Empirical model of bitterness with total phenols and oleuropein aglycone; abstract only, overlapping other rows |
| Unusual pungency from extra-virgin olive oil is attributable to restricted spatial expression of the receptor of oleocanthal (2011) doi | Read as context (not in the table) | Oleocanthal acts on the throat receptor TRPA1 to cause pungency; not a bitterness study |
| Activation of specific bitter taste receptors by olive oil phenolics and secoiridoids (2021) doi | Read as context (not in the table) | Cell assays with human bitter receptors; no human ratings |
| Evaluation of Packaging Effects on the Phenolic Profile and Sensory Characteristics of Extra Virgin Olive Oil During Storage Using Liquid Chromatography Coupled with Mass Spectrometry (2025) doi | Excluded | Mainly a comparison of storage and packaging, not designed around bitterness–compound correspondence, so not tabled (full text saved by the reader) |
| Chemesthetic Perception in Extra Virgin Olive Oil and Olive Ripening Stage: A Sensory Perspective (2026) doi | Read as context (not in the table) | Review of chemesthetic sensations and ripeness; not a primary study |
| Impact of Olive Variety and Cultivation Region on the Chemical Composition and Sensory Attributes of Turkish Olive Oils (2026) doi | Excluded | Full text saved by the reader but not read for this table |
| Effect of processing technology on chemical, sensory, and consumers' hedonic rating of seven olive oil varieties (2022) doi | Excluded | Full text saved by the reader but not read for this table (it measures sensory attributes and phenols in the same oils) |
Read in the encyclopedia
- Extra virgin olive oil — the food in this question
- Oleuropein — the precursor of candidate bitter compounds
- Does the way olive oil is extracted or stored change its bitterness? — a comparison page on whether extraction or storage changes bitterness (this page covers how phenolic content matches bitterness)
- Does adding sugar or salt suppress bitterness? — a comparison page in the same format
Source ledger
Each study's source can be reached from its section above. All of the lab's sources are listed in the source ledger.
How to cite this page
Aoki, M. (NIGAMI LAB) (2026). Which compounds set olive oil bitterness?. https://nigamilab.com/en/topics/olive-oil-bitterness/
Each claim card has a stable anchor (#clm-…). The dataset is CC BY 4.0; see the data page. Dataset DOI: 10.5281/zenodo.22739101