Topic hub — 2026-10-21
Is darker-roast coffee more bitter?
Dark roasts taste bitter and light roasts sour: a familiar explanation. What do studies say in which people compared the bitterness of coffees roasted to different degrees? This page lines up the included studies together with their conditions: the beans, how roast degree was measured, the brewing and its strength, and who rated it on what scale, alongside studies of compounds said to relate to bitterness (chlorogenic acids, caffeine). It then separates what was established within one experiment, what differences between studies might explain, and what this comparison alone cannot separate.
On this page (10 sections)
- What this page establishes
- What the included studies allow us to say
- Bitterness ratings at a glance
- Conditions and results, study by study
- What was established within an experiment
- Candidate explanations for the differences
- What is not known — what this comparison alone cannot separate
- How studies and rows were counted
- What we looked at
- Read in the encyclopedia
What this page establishes
- That when people compared coffees roasted to different degrees, the darker roast was more bitter in each study's pooled results, mostly significantly, though in one study the means reversed in some combinations of conditions (the bean lot or brew strength was not always matched).
- That the scales differ between studies, so the size of the gap cannot be compared, and the names and measures of roast degree are not aligned.
- That in one study chlorogenic acids and caffeine fell with darker roast while bitterness rose, and which compounds make dark roasts bitter has not been measured.
- That brew temperature also moved bitterness a lot, in some combinations closing the gap between roasts.
What the included studies allow us to say
- In studies where people tasted coffees of different roast degrees and compared bitterness (not necessarily with the same bean lot or equal strength), the darker roast was more bitter in each study's pooled results, mostly significantly. Even with strength equalised to 2%, the main effect of roast was significant (F=178.17). But one study found only 9.51 vs 9.97 (0–15) between medium and dark, with the means reversed in some combinations of conditions. Because the scales differ, the size of the gap cannot be compared between studies. [rows: Batali 2022 strength equalised to 2%; Liang 2024 by brew temperature (mean of 5 time points); Shi 2024 conventional cold brew; Shi 2024 ultra-high-pressure cold brew; Seninde 2018 cold brew, 4 coffees; Liu 2023 ranking]
- Which compounds increase to make dark roasts more bitter was not measured in the included studies. Where compounds were measured in the same brews, chlorogenic acids and caffeine fell with darker roast while bitterness rose, so the rise in that experiment is not explained by the amounts of these 2. Brewing also moves bitterness: in a comparison where all were served cold, the dark roast cold-brewed (about 37) and the light roast brewed hot (about 38) were about equally bitter. [rows: Shi 2024 total chlorogenic acids (conventional cold brew); Shi 2024 conventional cold brew; Liang 2024 by brew temperature (mean of 5 time points)]
Bitterness ratings at a glance
The results in which people rated bitterness, and compound levels. Values for "Darker roast" and "Lighter roast" are as reported in the tables or figures (values read from figures are marked as estimates). "Direction" shows which sample was more bitter; gaps the paper does not treat as a difference are shown as "about the same". Select a study name to jump to its detailed table.
Results in which people rated bitterness only. Where each value comes from (a table or a reading from a figure) is shown in its row; scales and methods differ between studies, so compare within a row, not across rows.
| Study | Comparison and condition | Measured as | Darker roast | Lighter roast | Direction / test |
|---|---|---|---|---|---|
| Batali 2022 | strength equalised to 2% Dark (Agtron 38) vs medium (48) and light (58), 3 origins × 3 brew temperatures | 0–100 line scale (10 people) | more bitter the darker (means not given) | means not given | Darker roast more bitter Tested, significant |
| Liang 2024 | by brew temperature (mean of 5 time points) Dark (Agtron 41.8) vs light (71.8) at 4, 22 and 92 °C | 0–100 (14 people; estimated from the figure; at 4, 22, 92 °C) | about 37, 48, 62 | about 30, 31, 38 | Darker roast more bitter Tested, significant |
| Shi 2024 | conventional cold brew Dark (Agtron 53) vs medium (62) and light (73) | mean ± SD (12 people; scale range not given) | 6.50 ± 0.42 | 4.30 ± 0.42 (medium), 3.00 ± 0.28 (light) | Darker roast more bitter Tested, significant |
| Shi 2024 | ultra-high-pressure cold brew Dark (Agtron 53) vs medium (62) and light (73) | mean ± SD (12 people; scale range not given) | 5.50 ± 0.40 | 3.35 ± 0.30 (medium), 2.00 ± 0.10 (light) | Darker roast more bitter Tested, significant |
| Seninde 2018 | cold brew, 4 coffees Dark vs medium (main-effect means across 4 coffees, 2 methods, 2 coffee-to-water ratios) | 0–15 (5 people) | 9.97 | 9.51 | Darker roast more bitter Tested, significant |
| Liu 2023 | ranking Medium vs cinnamon and light | rank sums (smaller = more bitter; 6 people × 3) | 26 (medium) | 35 (cinnamon), 47 (light) | Darker roast more bitter Tested, only some pairs significant |
| Liu 2023 | time-intensity Medium vs cinnamon and light | peak intensity, 0–100 (6 people) | peak 37 | peaks 28 and 28 | About the same Tested, not significant |
| Cleve 2025 | most dominant sensation Dark vs medium (both with 30% water added) | share choosing bitterness (13 people) | peak 69% (14 s) | peak 64% (17.5 s) | Darker roast more bitter Tested, only some pairs significant |
| Chen 2026 | descriptors S6–S8 vs S1–S5 | cupping descriptors (5 people) | burnt bitterness, bitter aftertaste, medicinal bitterness | no bitterness descriptors | Darker roast more bitter No test reported |
Conditions and results, study by study
For each study, the conditions for the beans, the roast, the brewing and the rating, and the results. Each row is one study × one measured result, so different comparisons in the same study are separate rows. Under each row we give where it is in the paper and whether it can be used to judge whether darker roasting makes coffee more bitter, with the reason. Nothing is left blank: "not given", "not read" and "not applicable" are kept apart.
Batali 2022 sensory only
Sensory Analysis of Full Immersion Coffee: Cold Brew Is More Floral, and Less Bitter, Sour, and Rubbery Than Hot Brew. Foods 11(16):2440 — doi:10.3390/foods11162440
- How deeply checked
- Checked in full text — Full text via Europe PMC (Tables 1–3 and text); supplementary Fig. S1 not viewed Checked by: LLM (one extracted, another checked against the source; no human check), 2026-10-21.
- Samples
- 3 arabicas (El Salvador, Ethiopia, Sumatra)
- Processing and cooking
- Agtron Gourmet values light 58, medium 48, dark 38 (medium and dark are averages); temperature, time and weight loss not given
- How it was served or eaten
- Full immersion, 100 g grounds to 500 g water: 4 °C (22 °C water added, then refrigerated 24–36 h), 22 °C (12–14 h) or 92 °C (left to cool at room temperature, 1–2 h), until extraction stopped; all diluted to 2% strength and served at 4 °C
- Who rated, on what scale
- Rated at home: 20 trained, 17 evaluated, 14 completed all sessions, and 4 with poor reproducibility excluded, leaving 10 analysed; 0–100 line scale, 3 replicates; ANOVA
| Measured | Comparison and condition | Darker roast | Lighter roast | Unit | Direction / test |
|---|---|---|---|---|---|
| Bitterness intensity (sensory) | strength equalised to 2% Dark (Agtron 38) vs medium (48) and light (58), 3 origins × 3 brew temperatures | more bitter the darker (means not given) | means not given | 0–100 line scale (10 people) | Darker roast more bitter Tested, significant |
| The main effect of roast degree was significant (F=178.17); brew temperature F=6.06; means by roast degree are given in neither text nor tables Where: Section 3.2, Table 3 For whether darker roasting makes coffee more bitter: Usable — Same coffees and brewing, only roast varied, strength equalised, rated by people with a test; but no values by roast degree | |||||
Liang 2024 sensory only
Sensory analysis of the flavor profile of full immersion hot, room temperature, and cold brewed coffee over time. Scientific Reports 14 — doi:10.1038/s41598-024-69867-6
- How deeply checked
- Checked in full text — Full text via Europe PMC and images of Table 1 and Fig. 5; Fig. 5 values estimated by eye Checked by: LLM (one extracted, another checked against the source; no human check), 2026-10-21.
- Samples
- One Central American blend
- Processing and cooking
- Agtron Gourmet values light 71.8 and dark 41.8 (the authors call the darker one the dark end of medium-dark); temperature and time not given
- How it was served or eaten
- Full immersion, 100 g grounds to 500 g water; 5 time points, 0–24 h at 4 and 22 °C and 0–60 min at 92 °C; concentrate diluted 2-fold (strength not equalised); served at about 6 °C, warming to about 12 °C while tasted
- Who rated, on what scale
- 14 trained panellists; 0–100 line scale, 3 replicates; ANOVA and LSD
| Measured | Comparison and condition | Darker roast | Lighter roast | Unit | Direction / test |
|---|---|---|---|---|---|
| Bitterness intensity (sensory) | by brew temperature (mean of 5 time points) Dark (Agtron 41.8) vs light (71.8) at 4, 22 and 92 °C | about 37, 48, 62 | about 30, 31, 38 | 0–100 (14 people; estimated from the figure; at 4, 22, 92 °C) | Darker roast more bitter Tested, significant |
| The darker roast was significantly more bitter at every temperature; roast main effect F=45.64, temperature F=66.62; all were served cold, and the dark roast at 4 °C (about 37) and the light roast at 92 °C (about 38) were about equal Where: Table 1, Fig. 5B For whether darker roasting makes coffee more bitter: Limited — Same blend at 2 roasts with a test, but strength not equalised, one coffee only, the dark roast is medium-dark, values average 5 time points, and all were served cold | |||||
Shi 2024 sensory + composition
Comparison of Ultra-High-Pressure and Conventional Cold Brew Coffee at Different Roasting Degrees: Physicochemical Characteristics and Volatile and Non-Volatile Components. Foods 13(19):3119 — doi:10.3390/foods13193119
- How deeply checked
- Checked in full text — Full text via Europe PMC (Tables 1–5); the abstract says the compounds increased, but Table 2 and the text say they decreased Checked by: LLM (one extracted, another checked against the source; no human check), 2026-10-21.
- Samples
- Ethiopian arabica (bought from the same company; whether the same lot, the variety and processing are not given)
- Processing and cooking
- States only that light, medium and dark correspond to Agtron color value zones 73, 62 and 53; the scale type and roasting conditions are not given
- How it was served or eaten
- 15 g grounds to 210 mL water; ultra-high pressure (300 MPa, 20 min) or conventional cold brew (4 °C, 12 h); strength not equalised
- Who rated, on what scale
- 12 Q Arabica graders; rated at 20 ± 3 °C, 3 replicates; scale range not given; means ± SD with significance letters (5% level)
| Measured | Comparison and condition | Darker roast | Lighter roast | Unit | Direction / test |
|---|---|---|---|---|---|
| Bitterness intensity (sensory) | conventional cold brew Dark (Agtron 53) vs medium (62) and light (73) | 6.50 ± 0.42 | 4.30 ± 0.42 (medium), 3.00 ± 0.28 (light) | mean ± SD (12 people; scale range not given) | Darker roast more bitter Tested, significant |
| All 3 levels differed significantly; strength rose significantly with darker roast (not equalised) Where: Tables 5 and 1 For whether darker roasting makes coffee more bitter: Limited — Beans bought from one company (whether the same lot is not stated) at 3 levels with a test; but roasting conditions and scale range not given, and strength rose with darker roast | |||||
| Bitterness intensity (sensory) | ultra-high-pressure cold brew Dark (Agtron 53) vs medium (62) and light (73) | 5.50 ± 0.40 | 3.35 ± 0.30 (medium), 2.00 ± 0.10 (light) | mean ± SD (12 people; scale range not given) | Darker roast more bitter Tested, significant |
| All 3 levels differed significantly; strength rose from 1.10 to 1.28% (not equalised) Where: Table 5 (bitterness), Table 1 (strength) For whether darker roasting makes coffee more bitter: Limited — As above | |||||
| Chlorogenic acids | total chlorogenic acids (conventional cold brew) Dark vs medium and light | 1.47 | 2.02 (medium), 2.45 (light) | mg/mL (brew) | Lighter roast higher Tested, significant |
| Caffeine was also significantly lower the darker (1.24 vs 1.35 and 1.48 mg/mL), while bitterness rose Where: Table 2, Section 3.2 For whether darker roasting makes coffee more bitter: Not usable — Compound levels, not human bitterness | |||||
Seninde 2018 sensory only
Determining the impact of roasting degree, coffee to water ratio and brewing method on the sensory characteristics of cold brew Ugandan coffee. Master's thesis, Kansas State University — source
- How deeply checked
- Checked in the full text of the underlying thesis — Read in the full PDF of the master's thesis (Kansas State University 2018) that the paper (Food Research International 2020) is based on (Table 2-2, Appendix Table C-1, Figure 2-3); the interaction figure for bitterness read from its text description only; the paper itself could not be reached Checked by: LLM (one extracted, another checked against the source; no human check), 2026-10-21.
- Samples
- 4 Ugandan green coffees: 2 arabica (washed AW, dry-processed AD) and 2 robusta (washed RW, dry-processed RD); each from a single origin (4 different regions and altitudes), no decaf
- Processing and cooking
- All 4 in the same roaster at 2 levels, medium and dark, set by bean L* (medium 23.43–24.26, dark 21.30–22.51); temperature and time not given
- How it was served or eaten
- 2 cold-brew methods (16 h immersion set at 35 °F; 3 h drip at 30–35 °F, with different grinds) × 8 or 12 g grounds per 100 mL water; 32 samples in all; served at 4–7 °C
- Who rated, on what scale
- 5 highly trained panellists; 0–15 scale in 0.5 steps (end-point meanings not given); 3 replicates; mixed-model ANOVA with pairwise comparisons
| Measured | Comparison and condition | Darker roast | Lighter roast | Unit | Direction / test |
|---|---|---|---|---|---|
| Bitterness intensity (sensory) | cold brew, 4 coffees Dark vs medium (main-effect means across 4 coffees, 2 methods, 2 coffee-to-water ratios) | 9.97 | 9.51 | 0–15 (5 people) | Darker roast more bitter Tested, significant |
| The main effect was significant but small; there was a 4-way interaction, and in some combinations the mean was higher for medium (tests of those individual gaps were not checked); bitter aftertaste was also significant (dark 10.32, medium 9.79) Where: Table C-1, pp. 52–56 For whether darker roasting makes coffee more bitter: Limited — Same 4 coffees at 2 levels with trained panellists and a test; no light roast, a small colour gap between medium and dark, and interactions | |||||
Liu 2023 sensory + composition
焙煎度がコーヒーの味に及ぼす影響. 十文字学園女子大学紀要 53:17-27 — source
- How deeply checked
- Checked in full text — Full PDF from the institutional repository (12 pages, an image PDF read by eye; Tables 1–4, Figs 1–5); 2022 is printed on the pages, while the repository gives March 2023 as the issue date; the abstract says bitterness became stronger by the TI method, but the text reports no significant difference Checked by: LLM (one extracted, another checked against the source; no human check), 2026-10-21.
- Samples
- One Ethiopian arabica (Typica line, natural process)
- Processing and cooking
- 3 levels, light, cinnamon and medium (light to medium; no dark roast); end temperatures 212.7, 218.0 and 224.1 °C; no colour values
- How it was served or eaten
- Cold brew, 10 g grounds to 180 g distilled water, 6 °C for 24 h; 25 mL served at 10 °C, held 10 s in the mouth then swallowed, rated up to 120 s
- Who rated, on what scale
- 6 screened and trained students; TI (0–100), TDS, TCATA and ranking, 3 replicates each
| Measured | Comparison and condition | Darker roast | Lighter roast | Unit | Direction / test |
|---|---|---|---|---|---|
| Bitterness intensity (sensory) | ranking Medium vs cinnamon and light | 26 (medium) | 35 (cinnamon), 47 (light) | rank sums (smaller = more bitter; 6 people × 3) | Darker roast more bitter Tested, only some pairs significant |
| Only light vs medium was significant (1% level) Where: Table 4, p. 25 For whether darker roasting makes coffee more bitter: Limited — Ranking of the same coffee at 3 levels; only 6 people and no dark roast | |||||
| Bitterness intensity (sensory) | time-intensity Medium vs cinnamon and light | peak 37 | peaks 28 and 28 | peak intensity, 0–100 (6 people) | About the same Tested, not significant |
| Values were larger for the darker roast (curve areas 1780 vs 1480 and 1230), but the text reports no significant difference (at odds with the abstract); no significant difference does not mean the same Where: Table 3, p. 22 For whether darker roasting makes coffee more bitter: Limited — As above; no significant difference in the time-intensity curves | |||||
| Caffeine | caffeine (brew) Medium vs cinnamon and light | 128.29 ± 0.66 | 123.44 ± 0.54, 119.37 ± 0.21 | mg/100 mL | About the same Tested, not significant |
| The text reports no significant difference; values were larger for the darker roast; no significant difference does not mean the same Where: p. 21, Fig. 2 For whether darker roasting makes coffee more bitter: Not usable — Compound levels, not human bitterness | |||||
Cleve 2025 sensory only
Effects of Roasting Level and Milk Addition on In Vivo Aroma Release and Perception of Coffee. Journal of Agricultural and Food Chemistry — doi:10.1021/acs.jafc.4c12852
- How deeply checked
- Checked in full text — Full text as PMC HTML (sections 2.1, 2.2, 3.1.1); the curves in Fig. 1 not viewed Checked by: LLM (one extracted, another checked against the source; no human check), 2026-10-21.
- Samples
- Ethiopian arabica
- Processing and cooking
- Roasted by a local roaster to medium and dark; the reported ground-coffee L*a*b* values give the dark roast a higher L*, which looks reversed (whether this is a slip cannot be told from the source)
- How it was served or eaten
- Drip brewer, 21.00 g grounds to 350.0 g water; every sample was 100 g brew plus 42.86 g (30%) of water, milk or oat drink, served at about 50 °C
- Who rated, on what scale
- 13 panellists; TDS (choosing the most dominant sensation at each moment, not intensity), 3 replicates; Fisher–Irwin test at each time point
| Measured | Comparison and condition | Darker roast | Lighter roast | Unit | Direction / test |
|---|---|---|---|---|---|
| Bitterness dominance (sensory) | most dominant sensation Dark vs medium (both with 30% water added) | peak 69% (14 s) | peak 64% (17.5 s) | share choosing bitterness (13 people) | Darker roast more bitter Tested, only some pairs significant |
| Bitterness dominated first in both; it was significantly more often chosen for the dark roast only for a few seconds mid-way; not an intensity comparison Where: Section 3.1.1 For whether darker roasting makes coffee more bitter: Limited — Share of most dominant sensation, not bitterness intensity | |||||
Chen 2026 composition only
From Chemical Transformations to Cup Quality: Integrated Insights into Key Non-Volatile Compounds, Aroma-Active Compounds and Sensory Evolution During Continuous Roasting Stages in Yunnan Arabica Coffee. Foods 15(19):3569 — doi:10.3390/foods15193569
- How deeply checked
- Checked in full text — Full text via Europe PMC, Table 1, image of Fig. 1, supplementary Table S1; Fig. 1 values estimated by eye Checked by: LLM (one extracted, another checked against the source; no human check), 2026-10-21.
- Samples
- Yunnan arabica (Catimor)
- Processing and cooking
- 8 stages S1–S8 (colour values 95.03 to 21.80; the instrument and scale are not named); 3 roasts per stage
- How it was served or eaten
- Cupping (1:18 coffee to water, above 90 °C); 5 cups per sample rated above 50 °C, at 35–50 °C and at 20–35 °C
- Who rated, on what scale
- SCA scores and descriptors from 5 trained panellists; no bitterness score item and no test on bitterness (compounds were tested)
| Measured | Comparison and condition | Darker roast | Lighter roast | Unit | Direction / test |
|---|---|---|---|---|---|
| Bitterness intensity (sensory) | descriptors S6–S8 vs S1–S5 | burnt bitterness, bitter aftertaste, medicinal bitterness | no bitterness descriptors | cupping descriptors (5 people) | Darker roast more bitter No test reported |
| No bitterness score and no test; a record that bitterness words appeared at the darker stages, not an intensity value Where: Table 1 For whether darker roasting makes coffee more bitter: Not usable — Descriptors only, with no scores or test | |||||
| Chlorogenic acids | total chlorogenic acids (beans) S8 vs S1 | about 0.35 | about 11.4 | × 10³ mg/kg dry weight (estimated from the figure) | Lighter roast higher No test reported |
| Fell stage by stage; caffeine showed no consistent change across the roasted stages Where: Section 3.1, Fig. 1 For whether darker roasting makes coffee more bitter: Not usable — Compound levels, not human bitterness | |||||
Lourith 2025 composition only
Quality characteristics of Coffea arabica cultivated in Thailand in response to roasting levels profiling its functional material applications. Beverage Plant Research 5: e022 — doi:10.48130/bpr-0025-0008
- How deeply checked
- Checked in full text — Full text on the publisher page and image of Fig. 2; Fig. 2 values estimated by eye Checked by: LLM (one extracted, another checked against the source; no human check), 2026-10-21.
- Samples
- Arabica from Doi Chang, Thailand
- Processing and cooking
- 15–20 min at 180 °C (light), 200–220 °C (medium) or 230 °C (dark)
- How it was served or eaten
- 8 g grounds shaken in 24 mL water for 30 min at room temperature, filtered and freeze-dried, and the extract analysed (3 replicates, one-way ANOVA)
- Who rated, on what scale
- No human evaluation
| Measured | Comparison and condition | Darker roast | Lighter roast | Unit | Direction / test |
|---|---|---|---|---|---|
| Chlorogenic acids | chlorogenic acid (extract) Dark (230 °C) vs medium and light | about 50 | about 365 (medium), 630 (light) | µg/mL (estimated from the figure) | Lighter roast higher No test reported |
| No significance marks in text or figure (only total phenolics are reported as significant) Where: Fig. 2a For whether darker roasting makes coffee more bitter: Not usable — Compound levels, not human bitterness, and no significance marks | |||||
What was established within an experiment
Only results where the same panel compared changed conditions within one study.
- With strength equalised to 2% across 3 origins and 3 brew temperatures, bitter rose with darker roast and the roast main effect was significant (F=178.17; means by roast are not given). [rows: Batali 2022 strength equalised to 2%]
- Brewing the same blend at 4, 22 and 92 °C and serving it cold, the darker roast (Agtron Gourmet 41.8) was significantly more bitter than the lighter (71.8) at every temperature (means of 5 time points, about 37, 48, 62 vs about 30, 31, 38, estimated). [rows: Liang 2024 by brew temperature (mean of 5 time points)]
- For beans bought from one company at 3 levels, bitterness rose significantly with darker roast in both cold brews (6.50, 4.30, 3.00 conventional), while total chlorogenic acids in the same brews fell (1.47, 2.02, 2.45 mg/mL). [rows: Shi 2024 conventional cold brew; Shi 2024 ultra-high-pressure cold brew; Shi 2024 total chlorogenic acids (conventional cold brew)]
- In cold brews of 4 Ugandan coffees, the main effect showed dark roast significantly more bitter (9.97) than medium (9.51), but the gap was small, and an interaction made medium more bitter on average in some combinations of conditions (whether those individual gaps were significant was not checked). [rows: Seninde 2018 cold brew, 4 coffees]
- Across 3 levels from light to medium, ranking found medium significantly more bitter than light, but the time-intensity curves showed no significant difference (peak 37 vs 28 and 28). [rows: Liu 2023 ranking; Liu 2023 time-intensity]
- For both medium and dark roasts with 30% water added, bitterness was the first dominant sensation (peaks 64% and 69%, at different moments); it was chosen significantly more for the dark roast only for a few seconds, and this is not an intensity comparison. [rows: Cleve 2025 most dominant sensation]
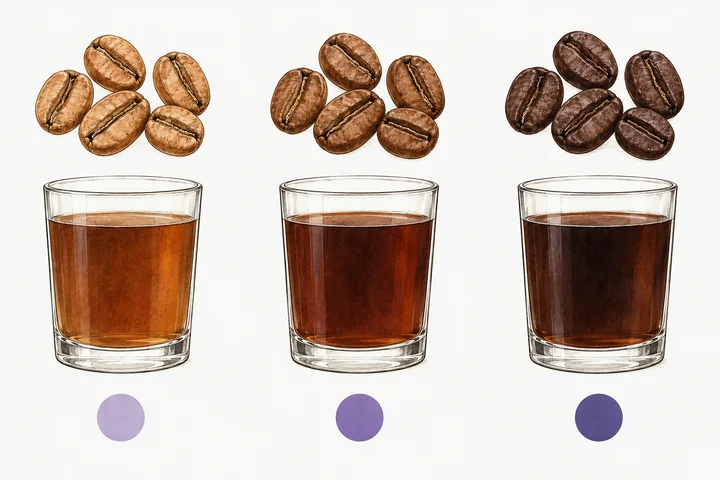
Light roast
Medium roast
Dark roast
A study in which light, medium and dark roasts of Ethiopian arabica bought from the same seller were made into conventional cold brew (4 °C, 12 hours). Bitterness differed significantly among all three and was higher the darker the roast. The shade of the purple marks shows order only, not the ratio of scores or the size of the differences. The strength of the brew was not matched and was higher the darker the roast, so this cannot be read as the effect of roasting alone. Whether the green beans came from the same lot was not confirmed. Do not extend it to hot-brewed coffee or espresso. The beans are drawn enlarged to show their colour. The purple is not a real colour.
Source: Shi et al. 2024 (Shi 2024 in the table of conditions and results by study)
Illustration: illustration desk (PurpleHeron)
Candidate explanations for the differences
Conditions that differ between studies, or between ways of brewing, and could explain differences in bitterness. Several conditions differ at once, so which one mattered is unknown. These are candidates, not causes.
- Differences in what "dark" means and how it was measured. In Agtron values one study's dark roast was 53, another's medium 48, and darks 41.8 or 38, but the scale behind 53 is not stated, so whether these share a scale cannot be confirmed. Names and measures that are not aligned may contribute to differences between studies. [rows: Shi 2024 conventional cold brew; Batali 2022 strength equalised to 2%; Liang 2024 by brew temperature (mean of 5 time points)]
- Brew strength. One study equalised strength to 2%, while in another strength rose with darker roast (from 1.10 to 1.28% in ultra-high-pressure cold brew). Without equalising, a strength difference may mix into the roast difference. [rows: Batali 2022 strength equalised to 2%; Shi 2024 ultra-high-pressure cold brew]
- Brew temperature. With the same beans, hot brewing was more bitter than cold brewing (all served cold), and the size of the roast gap changed with temperature. Differences in extraction between studies may contribute to differing results. [rows: Liang 2024 by brew temperature (mean of 5 time points)]
- A change in the kind of bitterness. In one study the words "burnt bitterness" and "medicinal bitterness" appeared only at the darkest stages. Intensity scores alone do not show such differences in quality. [rows: Chen 2026 descriptors]
What is not known — what this comparison alone cannot separate
- Why bitterness increases: where compounds and human bitterness were measured in the same brews, chlorogenic acids and caffeine fell while bitterness rose. No included study measured which compound increased to cause it. [rows: Shi 2024 total chlorogenic acids (conventional cold brew); Shi 2024 conventional cold brew]
- Aroma and taste: dark roasts also smell more burnt, but no study blocked aroma (for example by nose clips) when rating bitterness, so whether aroma leaks into bitterness ratings cannot be separated. [rows: Cleve 2025 most dominant sensation; Batali 2022 strength equalised to 2%]
- Beans and roasting: most studies used 1 coffee or blend, often without reporting roast temperature and time, so whether the same direction holds for other beans and roasting methods is unknown. [rows: Liang 2024 by brew temperature (mean of 5 time points); Shi 2024 conventional cold brew; Liu 2023 ranking]
How studies and rows were counted
The number of evidence rows is not the number of studies. Table rows, ledger evidence rows, papers and research groups are counted separately.
- Sources in the table: 8, of which 7 have results on people's bitterness ratings in this table; for the others, only results on something else (compounds, smell) are shown, or they are used only for context.
- Rows in the table (study × measured result): 13. Rows on perceived bitterness: 9.
- Evidence rows in the lab's ledger these rows rest on: 3. One paper can supply several rows. Rows without a ledger evidence row come from other tables of the same papers, or from sources newly read for this question.
- Research groups among the studies with bitterness results in this table, as grouped in the ledger: 6 (reports from the same lab count as 1; co-authors and affiliations can overlap, so this is not a count of independent replications).
What we looked at
The sources examined for this question, why each was included or excluded, and which full texts could not be reached. We searched Europe PMC, J-STAGE and CiNii for studies on coffee roast degree and sensory bitterness, followed citations, and added the sources already in the lab's ledger.
| Source | Decision | Why |
|---|---|---|
| Sensory Analysis of Full Immersion Coffee: Cold Brew Is More Floral, and Less Bitter, Sour, and Rubbery Than Hot Brew (2022) doi | Included in the table | People compared bitterness across roasts at equal strength; read in full |
| Sensory analysis of the flavor profile of full immersion hot, room temperature, and cold brewed coffee over time (2024) doi | Included in the table | People compared bitterness across roasts and brew temperatures; read in full |
| Comparison of Ultra-High-Pressure and Conventional Cold Brew Coffee at Different Roasting Degrees: Physicochemical Characteristics and Volatile and Non-Volatile Components (2024) doi | Included in the table | Measured human bitterness and compounds at 3 roasts; read in full |
| Determining the impact of roasting degree, coffee to water ratio and brewing method on the sensory characteristics of cold brew Ugandan coffee (2018) | Included in the table | Trained panellists compared bitterness of medium and dark roasts; read in the full thesis (the journal version was not read) |
| 焙煎度がコーヒーの味に及ぼす影響 (2023) | Included in the table | People compared 3 levels from light to medium; read in full |
| Effects of Roasting Level and Milk Addition on In Vivo Aroma Release and Perception of Coffee (2025) doi | Included in the table | People chose the dominant sensation for medium and dark roasts; read in full |
| From Chemical Transformations to Cup Quality: Integrated Insights into Key Non-Volatile Compounds, Aroma-Active Compounds and Sensory Evolution During Continuous Roasting Stages in Yunnan Arabica Coffee (2026) doi | Included in the table | Compounds and descriptors across 8 roast stages; read in full |
| Quality characteristics of Coffea arabica cultivated in Thailand in response to roasting levels profiling its functional material applications (2025) doi | Included in the table | Measured chlorogenic acid at 3 roasts; read in full |
| Quantitative studies on the influence of the bean roasting parameters and hot water percolation on the concentrations of bitter compounds in coffee brew (2010) doi | Read as context (not in the table) | Reports bitter compounds (quinides and their breakdown products) changing with roast; abstract only, with no sensory method or values in it |
| Effect of Roasting on the Formation of Chlorogenic Acid Lactones in Coffee (2005) doi | Read as context (not in the table) | Reports chlorogenic acid lactones peaking at light-medium roast; abstract only, no human evaluation |
| Effects of brew strength, brew yield, and roast on the sensory quality of drip brewed coffee (2020) doi | Full text not reachable | Close to this question, but the full text could not be reached (title copied from the reference lists of Batali 2022 and Liang 2024); the abstract gives no bitterness comparison between roasts |
Read in the encyclopedia
- Coffee roasting — the process in this question
- Coffee bitterness — the topic hub on what roasting makes and what else matters
- Roasting makes and changes bitterness — a research note following roasting and bitter compounds
- Arabica or robusta: which is more bitter? — a comparison page in the same format
Source ledger
Each study's source can be reached from its section above. All of the lab's sources are listed in the source ledger.
How to cite this page
Aoki, M. (NIGAMI LAB) (2026). Is darker-roast coffee more bitter?. https://nigamilab.com/en/topics/coffee-roast-degree/
Each claim card has a stable anchor (#clm-…). The dataset is CC BY 4.0; see the data page. Dataset DOI: 10.5281/zenodo.22739101